PROTECTED SOURCE SCRIPT
Liquidation Zone [Pt]
[SIZE=4]█ Introduction[/SIZE]
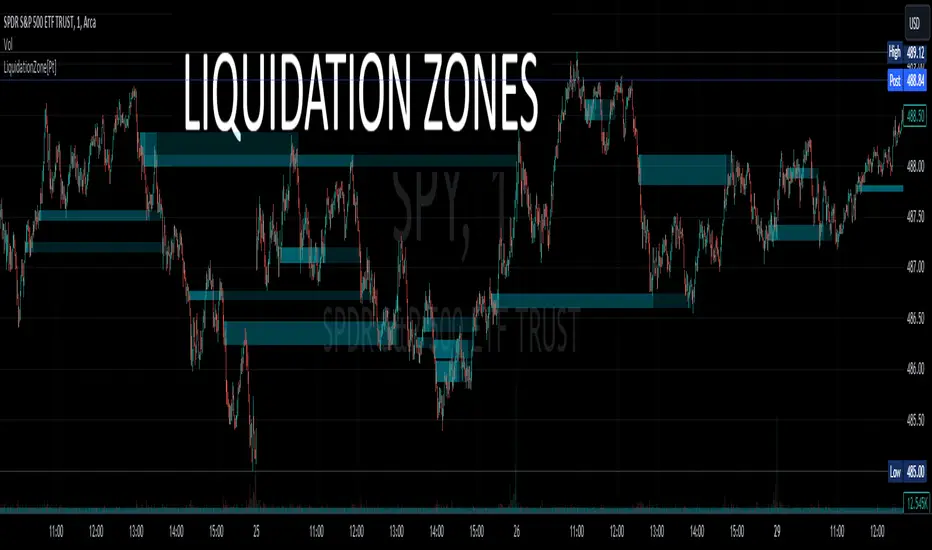
The [B]Liquidation Zone [Pt][/B] indicator is designed to identify key price ranges where significant market activity, such as the liquidation of positions, is likely to occur. These zones are identified based on a specific candlestick pattern, offering insights into potential areas of market sensitivity.
[SIZE=4][B]█ Key Features:[/B][/SIZE]
► [B]Specific Candlestick Pattern Identification:[/B] The indicator identifies liquidation zones by detecting a pattern where a red candle is encased within a series of green candles (in bullish scenarios) or a green candle within red candles (in bearish scenarios). This pattern often suggests a point where the market pauses to liquidate positions before continuing the prevailing trend.
► [B]Market Reaction Points:[/B] These liquidation zones represent significant levels where the market previously decided to liquidate or adjust positions, indicating potential areas where price might react upon revisit.
► [B]Integration with Volatility and Volume Data:[/B] The script combines these candlestick patterns with volatility (using ATR) and volume data, adding depth to the analysis and increasing the reliability of these zones as potential reaction areas.
► [B]Visual Zone Mapping on Charts:[/B] Liquidation Zones are clearly marked on the trading chart for easy identification, aiding traders in visualizing these critical market areas.
[SIZE=4][B]█ Possible Use Cases[/B][/SIZE]
[SIZE=3][B]► Identifying Potential Reaction Areas[/B][/SIZE]
Traders can use the [B]Liquidation Zone[/B] indicator to pinpoint zones where the market might pause or reverse due to previous liquidation activities. These areas can be key for planning entries, exits, or expecting increased market volatility.
[SIZE=3][B]► Enhancing Trading Strategy[/B][/SIZE]
Incorporating the analysis of liquidation zones into a trading strategy allows for a more nuanced understanding of market behavior, particularly in recognizing potential areas where price might experience significant support or resistance.
[SIZE=3][B]► Complementing Technical Analysis[/B][/SIZE]
This indicator is a valuable addition to a technical analyst's toolkit. When used alongside other analysis tools, it provides a more comprehensive view of the market, enhancing decision-making and strategy formulation.
نص برمجي محمي
تم نشر هذا النص البرمجي كمصدر مغلق. ومع ذلك، يمكنك استخدامه بحرية ودون أي قيود - تعرف على المزيد هنا.
Purchases / Subscriptions / Support - buymeacoffee.com/ptgambler
PayPal - paypal.me/PtGambler
You can reach me privately through my Discord Channel: discord.gg/WMQfaVGyQC
PayPal - paypal.me/PtGambler
You can reach me privately through my Discord Channel: discord.gg/WMQfaVGyQC
إخلاء المسؤولية
لا يُقصد بالمعلومات والمنشورات أن تكون، أو تشكل، أي نصيحة مالية أو استثمارية أو تجارية أو أنواع أخرى من النصائح أو التوصيات المقدمة أو المعتمدة من TradingView. اقرأ المزيد في شروط الاستخدام.