PROTECTED SOURCE SCRIPT
Western Astrological Cycle Trading Indicator v1.0
Western Astrological Cycle Trading Indicator v1.0
Overview
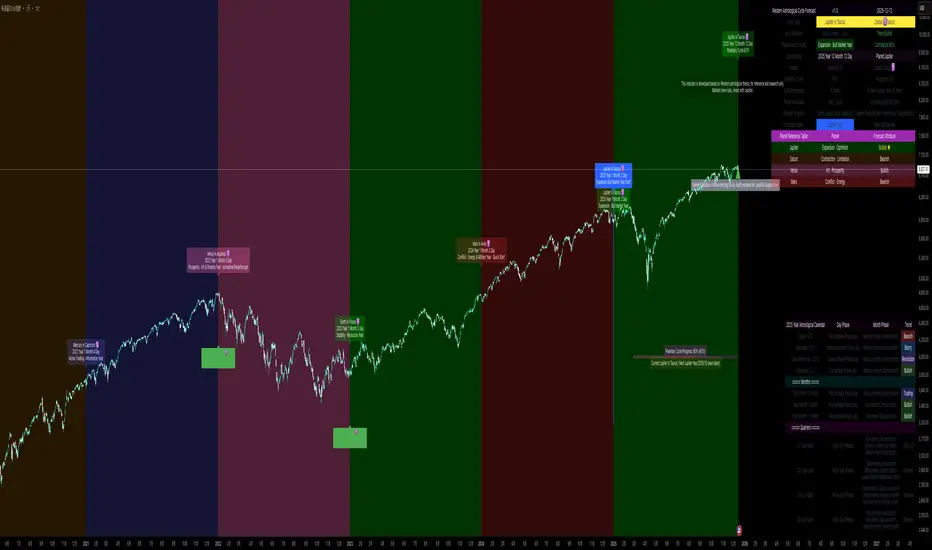
The Western Astrological Cycle Trading Indicator is a comprehensive Pine Script tool that overlays astrological cycles and predictions onto trading charts. It integrates Western astrological theory with technical analysis to provide unique cyclical perspectives on market movements based on planetary and zodiacal alignments.
What It Does
Core Functionality
Astrological Year Mapping:
Assigns each year (2000 onward) a specific planet-zodiac combination
Follows a 10-year planetary cycle and 12-year zodiac cycle
Generates theoretical market predictions based on these combinations
Visual Elements:
Background coloring based on yearly astrological predictions
Detailed information table with comprehensive astrological data
Year labels with zodiac symbols and predictions
Ten-year planetary cycle progress bar
Important year markers (Jupiter, Neptune, etc.)
Astrological calendar showing daily and monthly phases
Trading Insights:
Trend indicators (Bullish/Neutral/Bearish) based on planetary positions
Confidence levels for predictions
Element relationships affecting financial markets
Historical and future astrological phase tracking
How It Works
Technical Implementation
1. Cycle Calculation System
Planetary Cycle: 10-year rotation (Sun, Mercury, Venus, Earth, Mars, Jupiter, Saturn, Uranus, Neptune, Pluto)
Zodiac Cycle: 12-year rotation through all zodiac signs
Calculation:
pinescript
planetIndex = math.floor((year - 2000) % 10)
zodiacIndex = math.floor((year - 2000) % 12)
2. Prediction Engine
Each planet-zodiac combination generates specific predictions
Confidence scores (0-100%) assigned to each prediction
Trend direction determined by planetary attributes:
Bullish: Sun, Jupiter, Venus
Bearish: Mars, Saturn, Pluto
Neutral: Mercury, Uranus, Neptune
3. Visual Rendering System
Multiple label positioning algorithms to prevent overlap
Dynamic table generation with color-coded cells
Progress bar visualization of cycle completion
Time-aware markers that appear only on year transitions
4. Date Management
Comprehensive date calculation functions
Leap year detection
Day/month/year progression tracking
Future/past date predictions
Astrological Logic
The indicator uses traditional Western astrological correspondences:
Planets represent different market energies
Zodiac signs modify and color these energies
Elements (Fire, Earth, Air, Water) show elemental relationships
Modalities (Cardinal, Fixed, Mutable) indicate the nature of change
How to Use It
Installation
Open TradingView platform
Navigate to Pine Editor
Paste the entire script
Click "Add to Chart"
Configuration
Basic Settings
Show Background Color: Toggle prediction-based background coloring
Show Info Table: Display/hide the comprehensive information table
Show Year Labels: Toggle yearly astrological labels on the chart
Customization Options
Year Label Settings:
Choose label color
Adjust font size (small/normal/large)
Toggle year numbers and zodiac symbols
Planetary Cycle Progress:
Display ten-year cycle progress bar
Customize progress bar colors
Adjust position on chart
Marker Lines:
Toggle individual planet markers (Jupiter, Venus/Mars, Saturn/Uranus, Neptune)
Customize marker colors and positions
Adjust marker font sizes
Additional Elements:
Disclaimer display
Trend indicator
Element relationship hints
Current year information
Interpretation Guide
Reading the Information Table
The table provides:
Astro Year: Current planet-zodiac combination
Trend: Bullish/Neutral/Bearish direction
Theoretical Forecast: Market prediction based on astrology
Confidence: Probability score of prediction
Cycle Progress: Position in 10-year planetary cycle
Element Relation: How current element interacts with financial markets
Understanding Visual Elements
Background Colors:
Orange/Green: Bullish years (Sun, Jupiter, Venus)
Red/Brown: Bearish years (Mars, Saturn, Pluto)
Blue/Purple: Neutral/transitional years
Year Labels:
Appear at year transitions
Show planet-zodiac combination
Include prediction summary
Special Markers:
Jupiter Years: Blue markers - potential expansion/bull markets
Neptune Years: Purple markers - cycle endings/uncertainty
Saturn/Uranus Years: Red markers - contraction/revolution
Progress Bar:
Shows current position in 10-year cycle
Indicates years remaining to next Jupiter year
Using the Astrological Calendar
The bottom-right calendar shows:
Daily phases: Current planetary influences
Monthly phases: Broader monthly trends
Trend signals: Daily/monthly direction indicators
Quarterly overview: Longer-term perspectives
Practical Trading Application
Long-term Planning:
Use Jupiter year markers for potential bull market entries
Be cautious during Saturn/Pluto years (potential bear markets)
Note cycle transitions (Neptune years) for market shifts
Medium-term Analysis:
Consider monthly planetary changes for quarterly planning
Use element relationships to understand sector rotations
Short-term Awareness:
Check daily phases for potential reversal days
Monitor trend changes at month transitions
Risk Management:
Reduce position size during low-confidence periods
Increase vigilance during transition years
Use astrological signals as confluence with technical analysis
Alerts System
Enable alerts to receive notifications for:
Year transitions
Important astrological events
Cycle beginnings/endings
Important Notes
Theoretical Nature: This indicator is based on astrological theory, not financial advice
Confluence Trading: Use alongside traditional technical analysis
Backtesting: Always test strategies before live implementation
Risk Management: Never rely solely on astrological signals for trading decisions
Customization Tips
Label Overlap: Adjust label spacing if labels overlap
Performance: Reduce max_lines_count/max_labels_count if experiencing lag
Color Schemes: Customize colors to match your chart theme
Positioning: Adjust marker positions based on your chart's volatility
Disclaimer
This indicator is for educational and research purposes only. It combines astrological theory with technical analysis for experimental purposes. Past performance does not guarantee future results. Always conduct your own research and consult with financial advisors before making trading decisions.
Overview
The Western Astrological Cycle Trading Indicator is a comprehensive Pine Script tool that overlays astrological cycles and predictions onto trading charts. It integrates Western astrological theory with technical analysis to provide unique cyclical perspectives on market movements based on planetary and zodiacal alignments.
What It Does
Core Functionality
Astrological Year Mapping:
Assigns each year (2000 onward) a specific planet-zodiac combination
Follows a 10-year planetary cycle and 12-year zodiac cycle
Generates theoretical market predictions based on these combinations
Visual Elements:
Background coloring based on yearly astrological predictions
Detailed information table with comprehensive astrological data
Year labels with zodiac symbols and predictions
Ten-year planetary cycle progress bar
Important year markers (Jupiter, Neptune, etc.)
Astrological calendar showing daily and monthly phases
Trading Insights:
Trend indicators (Bullish/Neutral/Bearish) based on planetary positions
Confidence levels for predictions
Element relationships affecting financial markets
Historical and future astrological phase tracking
How It Works
Technical Implementation
1. Cycle Calculation System
Planetary Cycle: 10-year rotation (Sun, Mercury, Venus, Earth, Mars, Jupiter, Saturn, Uranus, Neptune, Pluto)
Zodiac Cycle: 12-year rotation through all zodiac signs
Calculation:
pinescript
planetIndex = math.floor((year - 2000) % 10)
zodiacIndex = math.floor((year - 2000) % 12)
2. Prediction Engine
Each planet-zodiac combination generates specific predictions
Confidence scores (0-100%) assigned to each prediction
Trend direction determined by planetary attributes:
Bullish: Sun, Jupiter, Venus
Bearish: Mars, Saturn, Pluto
Neutral: Mercury, Uranus, Neptune
3. Visual Rendering System
Multiple label positioning algorithms to prevent overlap
Dynamic table generation with color-coded cells
Progress bar visualization of cycle completion
Time-aware markers that appear only on year transitions
4. Date Management
Comprehensive date calculation functions
Leap year detection
Day/month/year progression tracking
Future/past date predictions
Astrological Logic
The indicator uses traditional Western astrological correspondences:
Planets represent different market energies
Zodiac signs modify and color these energies
Elements (Fire, Earth, Air, Water) show elemental relationships
Modalities (Cardinal, Fixed, Mutable) indicate the nature of change
How to Use It
Installation
Open TradingView platform
Navigate to Pine Editor
Paste the entire script
Click "Add to Chart"
Configuration
Basic Settings
Show Background Color: Toggle prediction-based background coloring
Show Info Table: Display/hide the comprehensive information table
Show Year Labels: Toggle yearly astrological labels on the chart
Customization Options
Year Label Settings:
Choose label color
Adjust font size (small/normal/large)
Toggle year numbers and zodiac symbols
Planetary Cycle Progress:
Display ten-year cycle progress bar
Customize progress bar colors
Adjust position on chart
Marker Lines:
Toggle individual planet markers (Jupiter, Venus/Mars, Saturn/Uranus, Neptune)
Customize marker colors and positions
Adjust marker font sizes
Additional Elements:
Disclaimer display
Trend indicator
Element relationship hints
Current year information
Interpretation Guide
Reading the Information Table
The table provides:
Astro Year: Current planet-zodiac combination
Trend: Bullish/Neutral/Bearish direction
Theoretical Forecast: Market prediction based on astrology
Confidence: Probability score of prediction
Cycle Progress: Position in 10-year planetary cycle
Element Relation: How current element interacts with financial markets
Understanding Visual Elements
Background Colors:
Orange/Green: Bullish years (Sun, Jupiter, Venus)
Red/Brown: Bearish years (Mars, Saturn, Pluto)
Blue/Purple: Neutral/transitional years
Year Labels:
Appear at year transitions
Show planet-zodiac combination
Include prediction summary
Special Markers:
Jupiter Years: Blue markers - potential expansion/bull markets
Neptune Years: Purple markers - cycle endings/uncertainty
Saturn/Uranus Years: Red markers - contraction/revolution
Progress Bar:
Shows current position in 10-year cycle
Indicates years remaining to next Jupiter year
Using the Astrological Calendar
The bottom-right calendar shows:
Daily phases: Current planetary influences
Monthly phases: Broader monthly trends
Trend signals: Daily/monthly direction indicators
Quarterly overview: Longer-term perspectives
Practical Trading Application
Long-term Planning:
Use Jupiter year markers for potential bull market entries
Be cautious during Saturn/Pluto years (potential bear markets)
Note cycle transitions (Neptune years) for market shifts
Medium-term Analysis:
Consider monthly planetary changes for quarterly planning
Use element relationships to understand sector rotations
Short-term Awareness:
Check daily phases for potential reversal days
Monitor trend changes at month transitions
Risk Management:
Reduce position size during low-confidence periods
Increase vigilance during transition years
Use astrological signals as confluence with technical analysis
Alerts System
Enable alerts to receive notifications for:
Year transitions
Important astrological events
Cycle beginnings/endings
Important Notes
Theoretical Nature: This indicator is based on astrological theory, not financial advice
Confluence Trading: Use alongside traditional technical analysis
Backtesting: Always test strategies before live implementation
Risk Management: Never rely solely on astrological signals for trading decisions
Customization Tips
Label Overlap: Adjust label spacing if labels overlap
Performance: Reduce max_lines_count/max_labels_count if experiencing lag
Color Schemes: Customize colors to match your chart theme
Positioning: Adjust marker positions based on your chart's volatility
Disclaimer
This indicator is for educational and research purposes only. It combines astrological theory with technical analysis for experimental purposes. Past performance does not guarantee future results. Always conduct your own research and consult with financial advisors before making trading decisions.
نص برمجي محمي
تم نشر هذا النص البرمجي كمصدر مغلق. ومع ذلك، يمكنك استخدامه بحرية ودون أي قيود - تعرف على المزيد هنا.
إخلاء المسؤولية
لا يُقصد بالمعلومات والمنشورات أن تكون، أو تشكل، أي نصيحة مالية أو استثمارية أو تجارية أو أنواع أخرى من النصائح أو التوصيات المقدمة أو المعتمدة من TradingView. اقرأ المزيد في شروط الاستخدام.