OPEN-SOURCE SCRIPT
تم تحديثه BBD Master
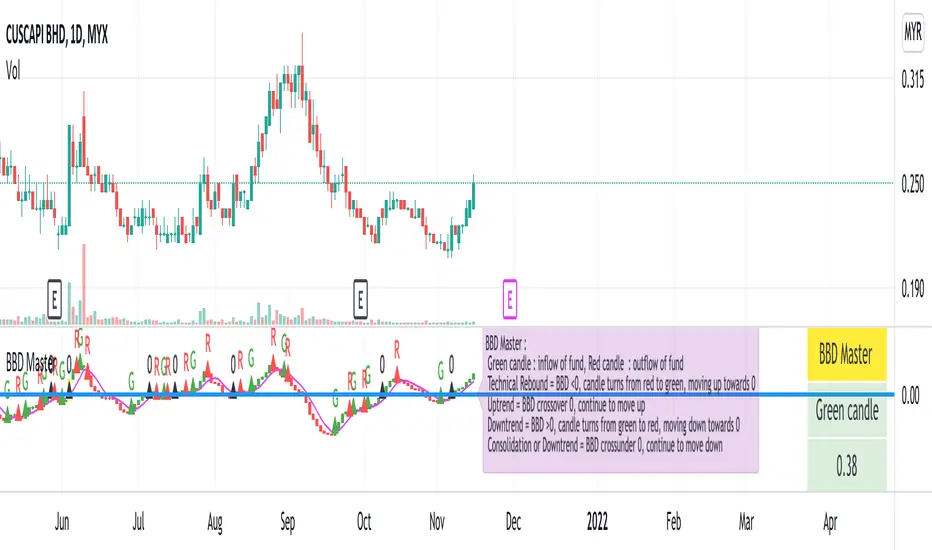
BBD Master :
An indicator attempts to simulate the net deviation of big buy (or inflow of fund) and big sell (or outflow of fund) of a stocks.
Regardless of BBD values, green candle means an inflow of fund resulting in net buy while red candle means an outflow of fund resulting in net sell.
It can be used for trend analysis.
When BBD is below 0 , BBD candle turns from red to green, and continue moving up towards 0, a potential sign of technical rebound.
When BBD crossover 0, and continue to move up, stocks may develop into an uptrend.
Open & Close, typically, will be above 20-day moving average.
When BBD is above 0, BBD candle turns from green to red, and continue moving down towards 0, stocks may develop into a downtrend, or at times, showing a top deviation where stocks price continue to move up while BBD moving down.
When BBD crossunder 0, and continue moving down, stocks may develop in a bearish trend or consolidation.
BBD Master, can be used together with chips master, trend master and MCDX Plus or indicators that users see fit, for better trend analysis.
Input/Comments are welcome to help improve the scripts, and may benefit users in long run. Hope this help.
Disclaimer : stocks used is meant to illustrate the indicator, no recommendation of buy/sell.
ملاحظات الأخبار
revision 2, added source input, candle turn green/turn red alerts and indicator descriptions. (Disclaimer : charted used is for illustration purpose only)نص برمجي مفتوح المصدر
بروح TradingView الحقيقية، قام مبتكر هذا النص البرمجي بجعله مفتوح المصدر، بحيث يمكن للمتداولين مراجعة وظائفه والتحقق منها. شكرا للمؤلف! بينما يمكنك استخدامه مجانًا، تذكر أن إعادة نشر الكود يخضع لقواعد الموقع الخاصة بنا.
إخلاء المسؤولية
لا يُقصد بالمعلومات والمنشورات أن تكون، أو تشكل، أي نصيحة مالية أو استثمارية أو تجارية أو أنواع أخرى من النصائح أو التوصيات المقدمة أو المعتمدة من TradingView. اقرأ المزيد في شروط الاستخدام.
نص برمجي مفتوح المصدر
بروح TradingView الحقيقية، قام مبتكر هذا النص البرمجي بجعله مفتوح المصدر، بحيث يمكن للمتداولين مراجعة وظائفه والتحقق منها. شكرا للمؤلف! بينما يمكنك استخدامه مجانًا، تذكر أن إعادة نشر الكود يخضع لقواعد الموقع الخاصة بنا.
إخلاء المسؤولية
لا يُقصد بالمعلومات والمنشورات أن تكون، أو تشكل، أي نصيحة مالية أو استثمارية أو تجارية أو أنواع أخرى من النصائح أو التوصيات المقدمة أو المعتمدة من TradingView. اقرأ المزيد في شروط الاستخدام.