OPEN-SOURCE SCRIPT
تم تحديثه US 20Y Treasury Yield
What This Indicator Does
This Pine Script creates a custom indicator for TradingView that displays the US 20-Year Treasury Yield (US20Y) on your chart. Here's what it does step by step:
1. What Is the US 20-Year Treasury Yield?
The US 20-Year Treasury Yield is a financial metric that shows the interest rate (or yield) investors earn when they buy US government bonds that mature in 20 years. It’s an important indicator of the economy and can influence other markets like stocks, bonds, and currencies.
2. How Does the Indicator Work?
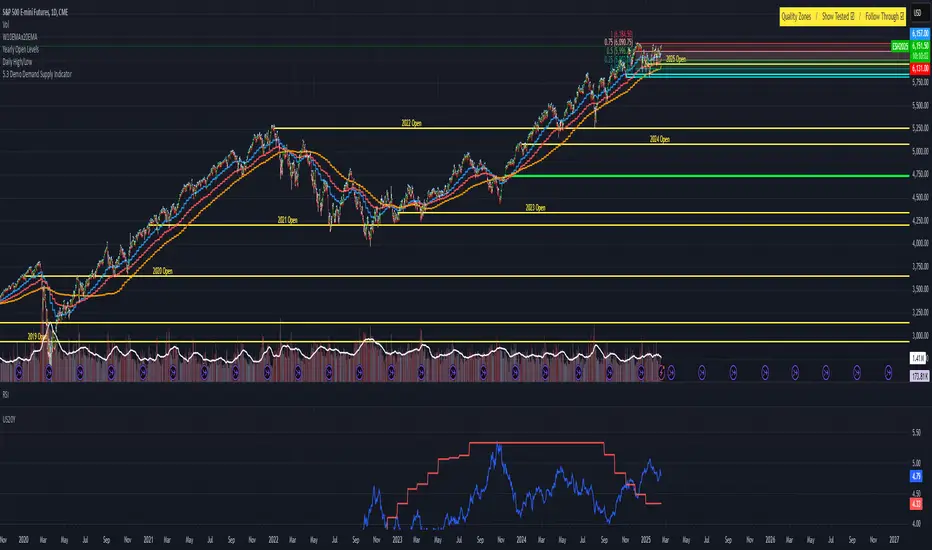
The indicator fetches the latest data for the US 20-Year Treasury Yield from TradingView's database.
It then plots this data in a separate pane below your main chart, so you can easily monitor the yield without cluttering your price chart.
3. What Does the Indicator Show?
A blue line is drawn in the separate pane, showing the movement of the US 20-Year Treasury Yield over time.
A gray dashed line is added at the 4.0% level as a reference point. You can use this line to quickly see when the yield is above or below 4.0%.
5. Why Use This Indicator?
Monitor Economic Trends : The US 20-Year Treasury Yield is a key economic indicator. By plotting it on your chart, you can stay informed about changes in interest rates and their potential impact on other markets.
This Pine Script creates a custom indicator for TradingView that displays the US 20-Year Treasury Yield (US20Y) on your chart. Here's what it does step by step:
1. What Is the US 20-Year Treasury Yield?
The US 20-Year Treasury Yield is a financial metric that shows the interest rate (or yield) investors earn when they buy US government bonds that mature in 20 years. It’s an important indicator of the economy and can influence other markets like stocks, bonds, and currencies.
2. How Does the Indicator Work?
The indicator fetches the latest data for the US 20-Year Treasury Yield from TradingView's database.
It then plots this data in a separate pane below your main chart, so you can easily monitor the yield without cluttering your price chart.
3. What Does the Indicator Show?
A blue line is drawn in the separate pane, showing the movement of the US 20-Year Treasury Yield over time.
A gray dashed line is added at the 4.0% level as a reference point. You can use this line to quickly see when the yield is above or below 4.0%.
5. Why Use This Indicator?
Monitor Economic Trends : The US 20-Year Treasury Yield is a key economic indicator. By plotting it on your chart, you can stay informed about changes in interest rates and their potential impact on other markets.
ملاحظات الأخبار
1. What Is the US 20-Year Treasury Yield?The US 20-Year Treasury Yield is a financial metric that shows the interest rate (or yield) investors earn when they buy US government bonds that mature in 20 years. It’s an important indicator of the economy and can influence other markets like stocks, bonds, and currencies.
2. How Does the Indicator Work?
The indicator fetches the latest data for the US 20-Year Treasury Yield from TradingView's database.
It then plots this data in a separate pane below your main chart, so you can easily monitor the yield without cluttering your price chart.
3. What Does the Indicator Show?
A blue line is drawn in the separate pane, showing the movement of the US 20-Year Treasury Yield over time.
A gray dashed line is added at the 4.0% level as a reference point. You can use this line to quickly see when the yield is above or below 4.0%.
نص برمجي مفتوح المصدر
بروح TradingView الحقيقية، قام مبتكر هذا النص البرمجي بجعله مفتوح المصدر، بحيث يمكن للمتداولين مراجعة وظائفه والتحقق منها. شكرا للمؤلف! بينما يمكنك استخدامه مجانًا، تذكر أن إعادة نشر الكود يخضع لقواعد الموقع الخاصة بنا.
إخلاء المسؤولية
لا يُقصد بالمعلومات والمنشورات أن تكون، أو تشكل، أي نصيحة مالية أو استثمارية أو تجارية أو أنواع أخرى من النصائح أو التوصيات المقدمة أو المعتمدة من TradingView. اقرأ المزيد في شروط الاستخدام.