OPEN-SOURCE SCRIPT
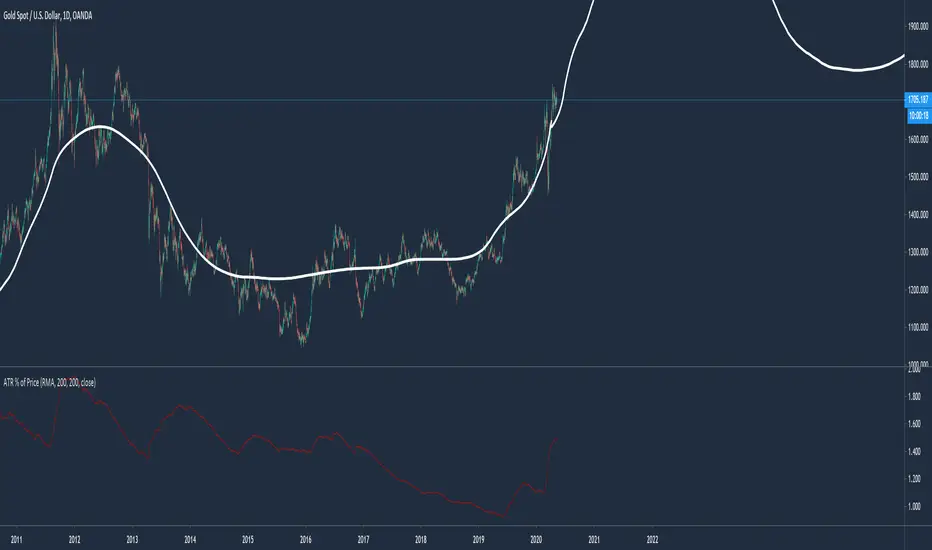
Average True Range % of Price

This script easily shows in an indicator window the Average True Range % of Price, which helps people understand the volatility of an asset in % terms defined by custom MA periods for custom ATR periods.
The MA Period gives the average price.
The ATR Period gives the average range.
The Average Range / Average Price = Average Range % of Price.
Understanding the volatility of an asset can help people manage risk e.g. if an asset has a low entry cost, but very high volatility it may be more risky than another asset with a high entry cost, but much lower volatility.
نص برمجي مفتوح المصدر
بروح TradingView الحقيقية، قام مبتكر هذا النص البرمجي بجعله مفتوح المصدر، بحيث يمكن للمتداولين مراجعة وظائفه والتحقق منها. شكرا للمؤلف! بينما يمكنك استخدامه مجانًا، تذكر أن إعادة نشر الكود يخضع لقواعد الموقع الخاصة بنا.
إخلاء المسؤولية
لا يُقصد بالمعلومات والمنشورات أن تكون، أو تشكل، أي نصيحة مالية أو استثمارية أو تجارية أو أنواع أخرى من النصائح أو التوصيات المقدمة أو المعتمدة من TradingView. اقرأ المزيد في شروط الاستخدام.