OPEN-SOURCE SCRIPT
تم تحديثه Original Bravo Swing
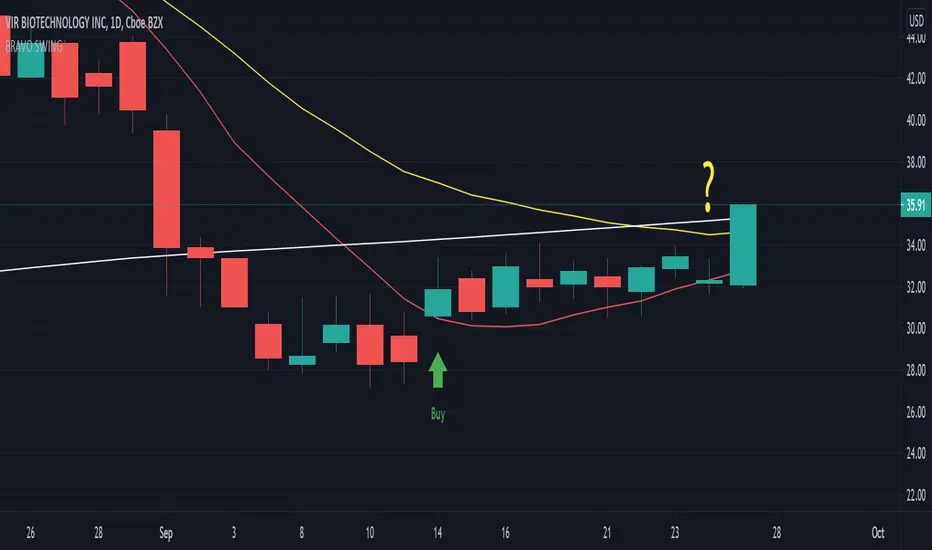
The Bravo Swing is based on the methods taught by YouTube celebrity J Bravo.
It uses the 9 day moving average as a base for selecting optimal entry and exit points.
Buy indicator:
A full candle closing above the 9 day moving average generally indicates a bullish signal for an entry.
If conditions are right, this can be seen as a great opportunity to buy.
Sell indicator:
If the candles continue to close above the 9 day moving average, the trend appears to remain bullish.
However, an exit is to be considered once a candle closes below the 9 day moving average, as this indicates a bearish signal may be approaching.
If you you're feeling confident about the uptrend continuing and choose to ignore the exit signal, a candle close below the 20 day exponential moving average should be used as a definite exit point.
Options:
Color code option to display the 180 day moving average in gray during downtrends and white during an uptrend.
The 50 day moving average can be turned on to help better visualize conflicting trends.
ملاحظات الأخبار
The sell indicator now shows ONLY when a red candle closes below the SMA 9 - indicating a strong bearish momentum.A question mark is now displayed when a green candle closes below the SMA 9 - indicating a 'possible' bearish momentum and an early exit should be considered (this can be turned off in settings).
نص برمجي مفتوح المصدر
بروح TradingView الحقيقية، قام مبتكر هذا النص البرمجي بجعله مفتوح المصدر، بحيث يمكن للمتداولين مراجعة وظائفه والتحقق منها. شكرا للمؤلف! بينما يمكنك استخدامه مجانًا، تذكر أن إعادة نشر الكود يخضع لقواعد الموقع الخاصة بنا.
إخلاء المسؤولية
لا يُقصد بالمعلومات والمنشورات أن تكون، أو تشكل، أي نصيحة مالية أو استثمارية أو تجارية أو أنواع أخرى من النصائح أو التوصيات المقدمة أو المعتمدة من TradingView. اقرأ المزيد في شروط الاستخدام.