PROTECTED SOURCE SCRIPT
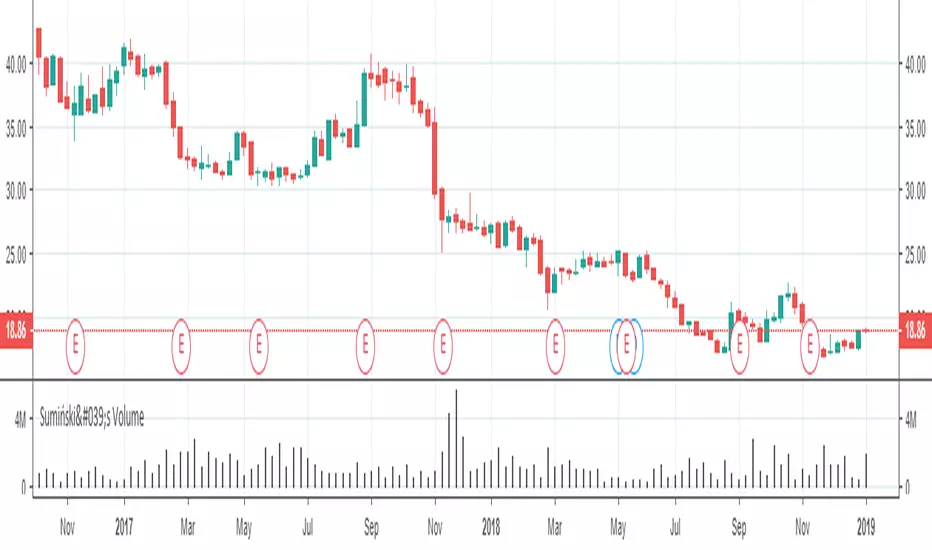
Sumiński's Volume

Hello, this indicator shows us the trading activity in the selected time period. It's similar to the tick volume, the difference being that this indicator is based on real volume. It measures the average amount of volume per 1 pips price in the selected time period. It is useful when after the end of the trend the price comes into consolidation, if at the levels close to support or resistance the indicator shows a high value - it means that there is an intense exchange of contracts or shares - which means that this price level is considered by the market as important.
Sorry for my English and good luck in the markets.
Sorry for my English and good luck in the markets.
نص برمجي محمي
تم نشر هذا النص البرمجي كمصدر مغلق. ومع ذلك، يمكنك استخدامه بحرية ودون أي قيود - تعرف على المزيد هنا.
إخلاء المسؤولية
لا يُقصد بالمعلومات والمنشورات أن تكون، أو تشكل، أي نصيحة مالية أو استثمارية أو تجارية أو أنواع أخرى من النصائح أو التوصيات المقدمة أو المعتمدة من TradingView. اقرأ المزيد في شروط الاستخدام.