OPEN-SOURCE SCRIPT
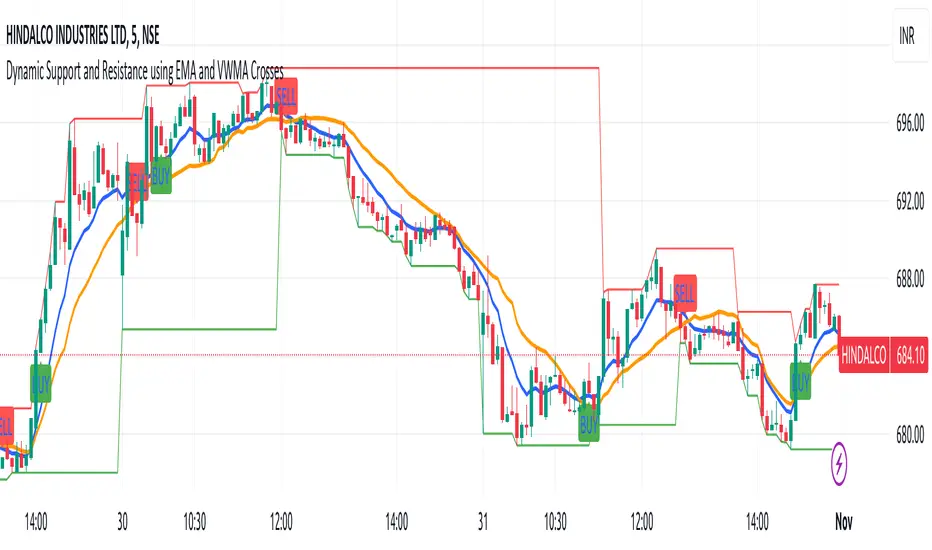
Intraday buy and sell indicator for stock and options

This powerful intraday trading indicator leverages two key crossovers for buy and sell signals, optimized for stocks and options trading:
EMA9 Crossover: The 9-period Exponential Moving Average (EMA9) responds quickly to price changes, making it ideal for capturing short-term momentum shifts. A bullish signal is generated when the stock price crosses above the EMA9, indicating a potential upward trend, while a bearish signal occurs when the price crosses below, signaling a potential reversal.
VWMA Crossover Confirmation: The Volume-Weighted Moving Average (VWMA) provides further confirmation of trend direction by integrating volume data. When the VWMA aligns with EMA9 (price crosses above both for buy or below for sell), the signals are validated, increasing the probability of a successful trade.
How It Works:
Buy Signal: Generated when the stock price crosses above EMA9 and VWMA in unison, indicating strong bullish momentum.
Sell Signal: Generated when the stock price crosses below EMA9 and VWMA, signaling potential bearish momentum.
This indicator is designed to provide high-quality entry and exit points for intraday trades, filtering out weaker signals and reducing whipsaws. It’s ideal for active traders seeking a strategic edge by combining price action with volume confirmation for higher probability trades.
نص برمجي مفتوح المصدر
بروح TradingView الحقيقية، قام مبتكر هذا النص البرمجي بجعله مفتوح المصدر، بحيث يمكن للمتداولين مراجعة وظائفه والتحقق منها. شكرا للمؤلف! بينما يمكنك استخدامه مجانًا، تذكر أن إعادة نشر الكود يخضع لقواعد الموقع الخاصة بنا.
إخلاء المسؤولية
لا يُقصد بالمعلومات والمنشورات أن تكون، أو تشكل، أي نصيحة مالية أو استثمارية أو تجارية أو أنواع أخرى من النصائح أو التوصيات المقدمة أو المعتمدة من TradingView. اقرأ المزيد في شروط الاستخدام.