INVITE-ONLY SCRIPT
MarketReader_Strategy
تم تحديثه
MarketReader_Strategy is a very useful and advanced indicator:
- It draws buying (green) and selling (orange) zone.
-Once the buying or selling zone is tapped, the color is automatically changed to grey
-It shows liquidity pool ($$$) engineered by market behaviour
Buying or selling area are determined by an algorithm that combines volume profile, Elliott Wave principles and order flow delivery.
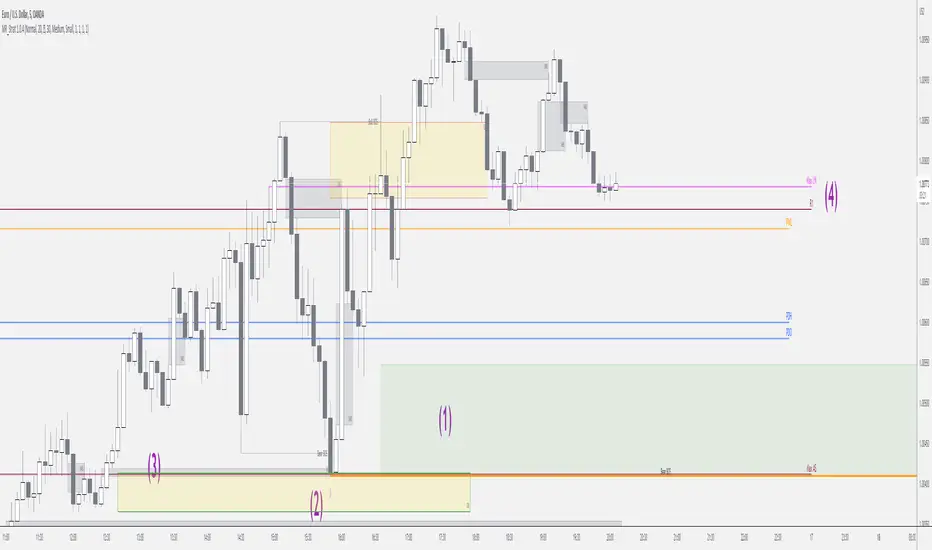
On the above example:
At “1”, you can see that the first buying zone is drawn since January 12
At “2”, the buying zone is tapped on January 18 with a strong bullish reaction.
At “3” and “3’”, you can see that liquidity pool has been created by market maker on both buying and selling side. It is typical of market behavior.
Market maker will take the downside liquidity by targeting the buying zone and then reverse (to the upside) targeting the upside liquidity pool that fuel the pump to the selling zone “4”. This selling zone is reached at “5” with a strong bearish reaction.
“6” represent active buying zone, waiting to be tapped.
To buy or take profit on these areas will depend on market behavior on the way down. Does the market engineer liquidity before? We use 2 complementary indicators helping us to take position on these areas but feel free to experiment with your own.
Usually, I wait price comes to selling or buying zone, then I go on lower timeframe (15 to 30 times lower) searching for divergences and convergences on Momemtum reader (also available on tradingview)
This indicator does not repaint and works on Forex, Crypto, Indices, Commodities and stock.
- It draws buying (green) and selling (orange) zone.
-Once the buying or selling zone is tapped, the color is automatically changed to grey
-It shows liquidity pool ($$$) engineered by market behaviour
Buying or selling area are determined by an algorithm that combines volume profile, Elliott Wave principles and order flow delivery.
On the above example:
At “1”, you can see that the first buying zone is drawn since January 12
At “2”, the buying zone is tapped on January 18 with a strong bullish reaction.
At “3” and “3’”, you can see that liquidity pool has been created by market maker on both buying and selling side. It is typical of market behavior.
Market maker will take the downside liquidity by targeting the buying zone and then reverse (to the upside) targeting the upside liquidity pool that fuel the pump to the selling zone “4”. This selling zone is reached at “5” with a strong bearish reaction.
“6” represent active buying zone, waiting to be tapped.
To buy or take profit on these areas will depend on market behavior on the way down. Does the market engineer liquidity before? We use 2 complementary indicators helping us to take position on these areas but feel free to experiment with your own.
Usually, I wait price comes to selling or buying zone, then I go on lower timeframe (15 to 30 times lower) searching for divergences and convergences on Momemtum reader (also available on tradingview)
This indicator does not repaint and works on Forex, Crypto, Indices, Commodities and stock.
ملاحظات الأخبار
Minor bug correctionملاحظات الأخبار
Minor bug correctionملاحظات الأخبار
Major update:-Optimisation of Orderblock/POI/Supply/demand zone filtering
-Adding FVG-Imbalance plotting
-Automatic plot of Asian range High-Low and its SD (S1-2 R1-2)
-Automatic plot of London High-Low
-Automatic plot of Previous Daily and Weekly High and Low
-Automatic plot of Liquidity pool ($ symbol)
So many people think that POI/OB/Supply-Demand zone are just the last bullish or bearish candle but it is more complicated than that. Our algorithm performs an advanced filtering according to volume, market structure, and oderflow.
All options are customizable.
in the graph:
(1) Untouched OrderBlock/POI/etc
(2) Consummed OrderBloc/POI/etc => Nice bounce on it ;-)
(3) Imbalance juste above OB
(4) London and Asian High-Low// Previous daily and Weekly High-Low
ملاحظات الأخبار
Minor update:-correction of Volatility support and resistance
-Add option
نص برمجي للمستخدمين المدعوين فقط
الوصول إلى هذا النص مقيد للمستخدمين المصرح لهم من قبل المؤلف وعادة ما يكون الدفع مطلوباً. يمكنك إضافته إلى مفضلاتك، لكن لن تتمكن من استخدامه إلا بعد طلب الإذن والحصول عليه من مؤلفه. تواصل مع nonobdx للحصول على مزيد من المعلومات، أو اتبع إرشادات المؤلف أدناه.
TradingView does not suggest paying for a script and using it unless you 100% trust its author and understand how the script works. In many cases, you can find a good open-source alternative for free in our Community Scripts.
هل تريد استخدام هذا النص البرمجي على الرسم البياني؟
تحذير: يرجى القراءة قبل طلب الوصول.
Apprendre la méthode:
discord.gg/b7YGtY2
Site internet: marketreader.fr/
Chaine Youtube : youtube.com/channel/UC-a7p8DkfbDM6ONrTzsaErA?view_as=subscriber
discord.gg/b7YGtY2
Site internet: marketreader.fr/
Chaine Youtube : youtube.com/channel/UC-a7p8DkfbDM6ONrTzsaErA?view_as=subscriber
إخلاء المسؤولية
لا يُقصد بالمعلومات والمنشورات أن تكون، أو تشكل، أي نصيحة مالية أو استثمارية أو تجارية أو أنواع أخرى من النصائح أو التوصيات المقدمة أو المعتمدة من TradingView. اقرأ المزيد في شروط الاستخدام.