OPEN-SOURCE SCRIPT
Auto-Anchored MA with Deviation Bands
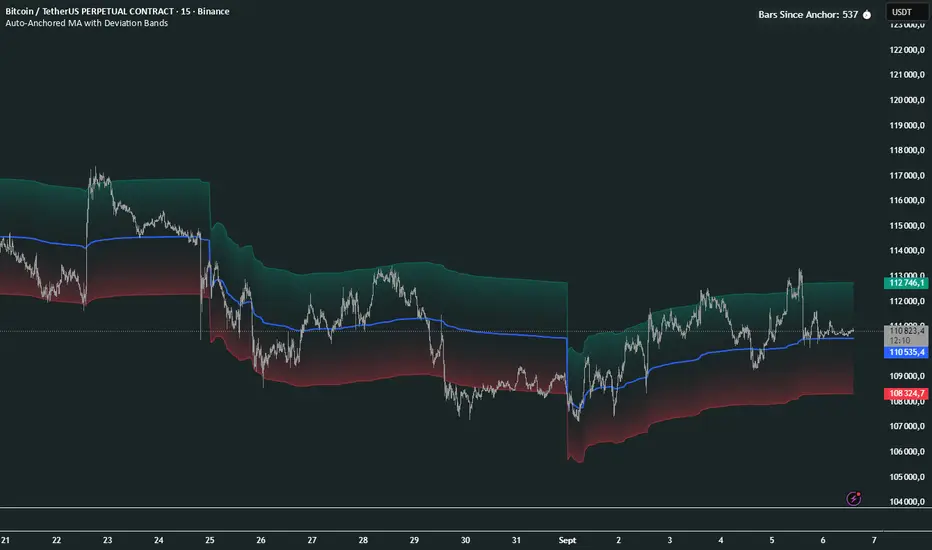
Auto-Anchored MA with Deviation Bands
✨ Features
📈 Auto-Anchored MA: Calculates moving averages (EMA, SMA, EWMA, WMA, VWAP, TEMA) anchored to user-defined periods (Hour, Day, Week, etc.).📏 Deviation Bands: Plots upper/lower bands using Percentage or Standard Deviation modes for volatility analysis.⚙️ Customizable Timeframes: Choose anchor periods from Hour to Year for flexible trend analysis.🎨 Visuals: Displays MA and bands with gradient fills, customizable colors, and adjustable display bars.⏱️ Countdown Table: Shows bars since the last anchor for easy tracking.🛠️ Smoothing: Applies smoothing to bands for cleaner visuals.
🛠️ How to Use
Add to Chart: Apply the indicator on TradingView.
Configure Inputs:
Anchor Settings: Select anchor period (e.g., Day, Week).
MA Settings: Choose MA type (e.g., VWAP, TEMA).
Deviation Settings: Set deviation mode (Percentage/Std Dev) and multipliers.
Display Settings: Adjust bars to display, colors, and gradient fill.
Analyze: View MA, deviation bands, and countdown table on the chart.
Track Trends: Use bands as dynamic support/resistance and monitor anchor resets.
🎯 Why Use It?
Dynamic Analysis: Auto-anchors MA to key timeframes for adaptive trend tracking.
Volatility Insight: Deviation bands highlight potential breakouts or reversals.
Customizable: Tailor MA type, timeframe, and visuals to your trading style.
User-Friendly: Clear visuals and countdown table simplify analysis.
📝 Notes
Ensure sufficient bars for accurate MA and deviation calculations.
Gradient fill enhances readability but can be disabled for simplicity.
Best used with complementary indicators like RSI or Bollinger Bands for robust strategies.
Happy trading! 🚀📈
نص برمجي مفتوح المصدر
بروح TradingView الحقيقية، قام مبتكر هذا النص البرمجي بجعله مفتوح المصدر، بحيث يمكن للمتداولين مراجعة وظائفه والتحقق منها. شكرا للمؤلف! بينما يمكنك استخدامه مجانًا، تذكر أن إعادة نشر الكود يخضع لقواعد الموقع الخاصة بنا.
My Website for the traders !
إخلاء المسؤولية
لا يُقصد بالمعلومات والمنشورات أن تكون، أو تشكل، أي نصيحة مالية أو استثمارية أو تجارية أو أنواع أخرى من النصائح أو التوصيات المقدمة أو المعتمدة من TradingView. اقرأ المزيد في شروط الاستخدام.