OPEN-SOURCE SCRIPT
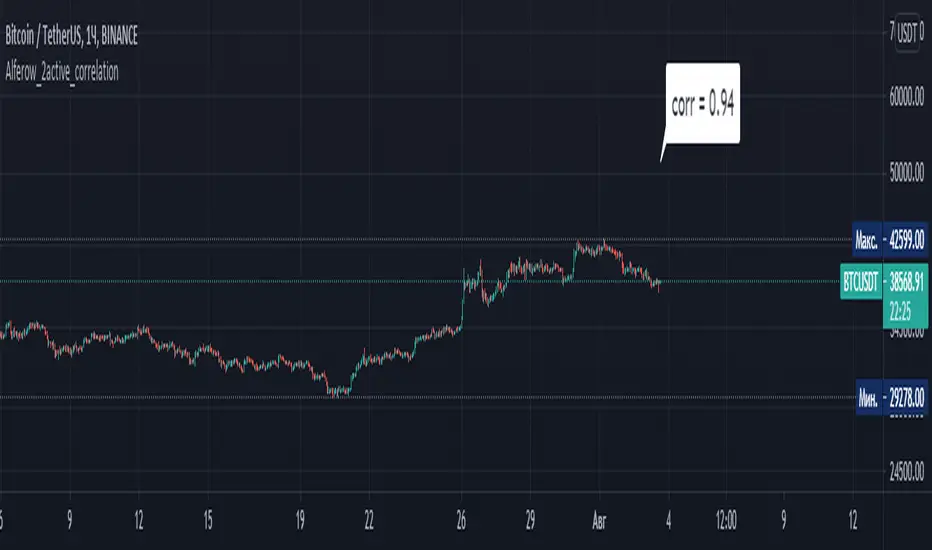
Alferow_2active_correlation

An indicator showing the coefficient of linear correlation between two assets for the selected period. As the initial data, the following are set: the indicator of the candle, according to which the calculation is made (maximum, minimum, closing or opening); the period for analysis; two assets between which the correlation is considered. The output is a label with the value of the correlation coefficient.
نص برمجي مفتوح المصدر
بروح TradingView الحقيقية، قام مبتكر هذا النص البرمجي بجعله مفتوح المصدر، بحيث يمكن للمتداولين مراجعة وظائفه والتحقق منها. شكرا للمؤلف! بينما يمكنك استخدامه مجانًا، تذكر أن إعادة نشر الكود يخضع لقواعد الموقع الخاصة بنا.
إخلاء المسؤولية
لا يُقصد بالمعلومات والمنشورات أن تكون، أو تشكل، أي نصيحة مالية أو استثمارية أو تجارية أو أنواع أخرى من النصائح أو التوصيات المقدمة أو المعتمدة من TradingView. اقرأ المزيد في شروط الاستخدام.