OPEN-SOURCE SCRIPT
Granular MA Ribbon
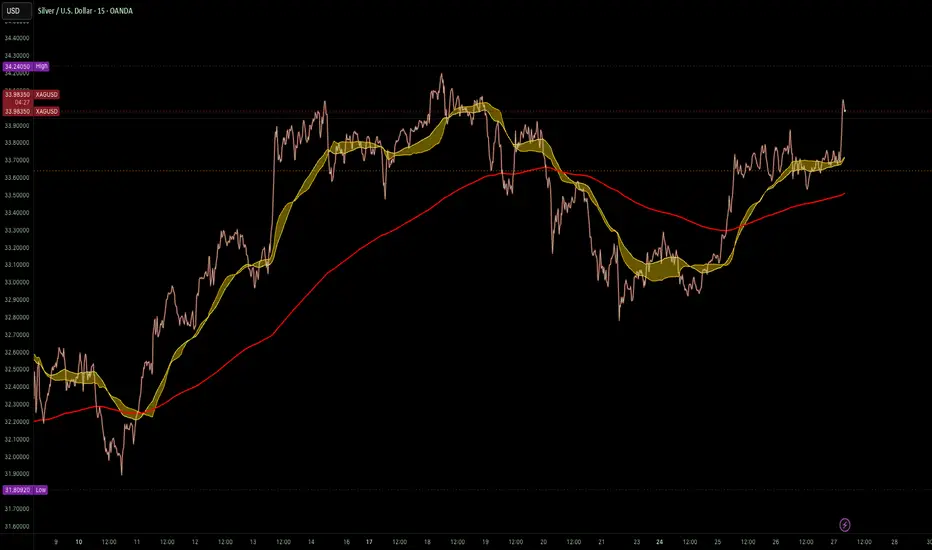
🎗️ The Granular MA Ribbon provides a structured view of price action on lower timeframes by incorporating both price-based and volume-weighted moving averages, offering a more nuanced view of market trends and momentum shifts. Furthermore, by using 15-minute intervals for its calculations, it ensures that intraday traders receive a smooth and responsive representation of higher timeframe trends.
⚠️ Note that this indicator is specifically optimized for the 15-minute and 1-hour charts; applying it to longer or shorter periods will distort its calculations and reduce its effectiveness. Adjust visibility settings accordingly.
🧰 Unlike traditional moving averages that may lag or fail to reflect real-time shifts in price dynamics, the Granular MA Ribbon includes a one-day exponential moving average (1D EMA), a one-day volume-weighted moving average (1D VWMA), and a one-week exponential moving average (1W EMA). Together, these elements allow traders to stay aligned with the broader market while making precise intraday trading decisions.
🤷🏻 Why Two Daily Moving Averages?
🔊 Instead of relying on a single moving average, this indicator uses both an EMA and a VWMA to provide a clearer picture of price movement. The EMA reacts quickly to price changes, making it a useful tool for identifying short-term momentum shifts. The VWMA, meanwhile, accounts for volume, ensuring that price movements supported by higher trading activity carry greater weight in the trend calculation.
💪🏻 When the EMA and VWMA diverge significantly, it signals strong momentum. If they begin to converge, it suggests that momentum is weakening or that price may be entering consolidation. The space between these two moving averages is filled with a ribbon, making it easier to see shifts in trend strength. A wide ribbon typically indicates strong momentum, while a narrowing ribbon suggests the trend may be losing steam.
🧮 Calculation Rationale
🔎 The 1D EMA and 1D VWMA are constructed using 15-minute blocks to maintain accuracy on lower timeframes. A full trading day consists of 96 fifteen-minute intervals. Instead of relying on daily candle data, which would reduce the granularity of the moving averages, this method allows the indicator to reflect intra-day trends more accurately. By breaking the day into smaller increments, the moving averages adapt more smoothly to changes in price and volume, making them more reliable for traders working on shorter timeframes.
🔍 The weekly EMA follows the same logic, adjusting based on the selected five-day or seven-day setting. If the market follows a standard five-day trading week, the one-week EMA is calculated using 480 fifteen-minute bars. If the market trades seven days a week, such as in crypto, the weekly EMA is adjusted accordingly to reflect 672 fifteen-minute bars. This setting ensures that traders using the indicator across different asset classes receive accurate trend information.
🫤 Sideways Markets
🔄 When the broader market is in a range-bound state, with no clear trend on the one-day or one-week chart, this indicator helps traders make sense of the short-term price structure. In these conditions, the ribbon will often appear flat, with the 1D EMA and 1D VWMA frequently crossing each other. This suggests that momentum is weak and that price action lacks a strong directional bias.
⚠️ A narrowing ribbon in a sideways market indicates reduced volatility and a potential breakout. If the EMA crosses above the VWMA during consolidation, it may signal a short-term upward move, especially if volume begins to increase. Conversely, if the EMA moves below the VWMA, it could indicate that selling pressure is increasing. However, in choppy conditions, crossovers alone are not enough to confirm a trade. Traders should wait for additional confirmation, such as a breakout from a defined range or a shift in volume.
♭ If the weekly EMA remains flat while the daily ribbon fluctuates, it confirms that the market lacks a strong trend. In such cases, traders may consider fading moves near the top and bottom of a range rather than expecting sustained breakouts.
💹 Trending Markets
🏗️ When the market is in a strong uptrend or downtrend, the ribbon takes on a more structured shape. A widening ribbon that slopes upward signals strong bullish momentum, with price consistently respecting the 1D EMA and VWMA as support. In a downtrend, the ribbon slopes downward, acting as dynamic resistance.
📈 In trending conditions, traders can use the ribbon to time pullback entries. In an uptrend, price often retraces to the VWMA before resuming its upward move. If price holds above both the EMA and VWMA, the trend remains strong. If price begins to close below the VWMA but remains above the EMA, it suggests weakening momentum but not necessarily a reversal. A clean break below both moving averages indicates a shift in trend structure.
📊 The one-week EMA serves as a higher timeframe guide. When price remains above the weekly EMA, it confirms that the broader trend is intact. If price pulls back to the weekly EMA and bounces, it can provide a high-confidence trade entry. Conversely, if price breaks below the weekly EMA and fails to reclaim it, it suggests that the trend may be reversing.
⏳ 5-Day and 7-Day Week Variants
🎚️ The setting for a five-day or seven-day trading week adjusts the calculation of the one-week EMA. This ensures that the indicator remains accurate across different asset classes.
5️⃣ A five-day trading week is appropriate for stocks, futures, and forex markets, where trading pauses on weekends. Using a seven-day week for these markets would create artificial distortions by including non-trading days. 7️⃣ In contrast, the seven-day week setting is ideal for crypto markets, which trade continuously. Without this adjustment, the weekly EMA would fail to reflect weekend price action, leading to misleading trend signals.
🧐 This indicator is expressly designed to complement its higher timeframe counterpart, the Triple Differential Moving Average Braid, optimized for the 1-Day chart.
نص برمجي مفتوح المصدر
بروح TradingView الحقيقية، قام مبتكر هذا النص البرمجي بجعله مفتوح المصدر، بحيث يمكن للمتداولين مراجعة وظائفه والتحقق منها. شكرا للمؤلف! بينما يمكنك استخدامه مجانًا، تذكر أن إعادة نشر الكود يخضع لقواعد الموقع الخاصة بنا.
adrian dyer
إخلاء المسؤولية
لا يُقصد بالمعلومات والمنشورات أن تكون، أو تشكل، أي نصيحة مالية أو استثمارية أو تجارية أو أنواع أخرى من النصائح أو التوصيات المقدمة أو المعتمدة من TradingView. اقرأ المزيد في شروط الاستخدام.