OPEN-SOURCE SCRIPT
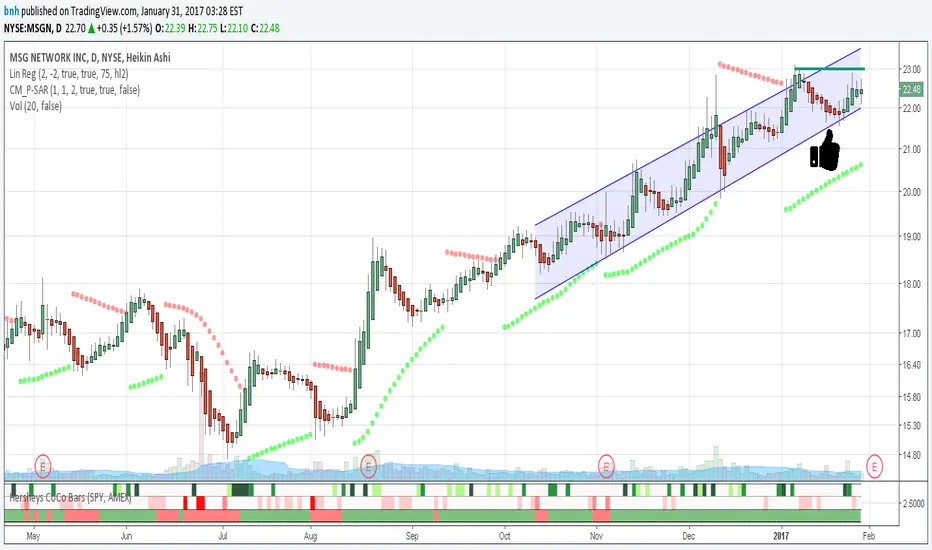
Hersheys CoCo Bars
This is my latest attempt to show price movement differences between symbols. I want to see the buying and selling pressure... is that price movement going with the market or is it moving alone? It's VERY interesting to watch this indicator and see how things play out!
In my previous versions the arrows on the chart were too much clutter, while the single row of color under the chart was not enough info. Also, I removed the calculations to build a world index because the correlation between US and world markets is a hard nut to crack, plus it took many seconds to calculate.
So here is "CoCo Bars", which clearly show price moves with or against another symbol. The default symbol is the US index SPY. The coolest thing here is there are three rows of data in ONE INDICATOR! Many thanks to user rollas for helping with that code.
"CoCo" stands for correlation coefficient, which is what I was studying when I got the idea for this project.
GREEN bars in row #1 = Symbol up, US up, Symbol up more than US
RED bars in row #2 = Symbol down, US down, Symbol down more than US
In rows 1 and 2 the color intensity is based on the biggest difference, light, medium and dark colors.
green/red colors in bottom row are a 7 period average of the sum of price changes of both symbol and index, green = positive, red = negative
Enjoy, and good trading!
Brian Hershey
نص برمجي مفتوح المصدر
بروح TradingView الحقيقية، قام مبتكر هذا النص البرمجي بجعله مفتوح المصدر، بحيث يمكن للمتداولين مراجعة وظائفه والتحقق منها. شكرا للمؤلف! بينما يمكنك استخدامه مجانًا، تذكر أن إعادة نشر الكود يخضع لقواعد الموقع الخاصة بنا.
إخلاء المسؤولية
لا يُقصد بالمعلومات والمنشورات أن تكون، أو تشكل، أي نصيحة مالية أو استثمارية أو تجارية أو أنواع أخرى من النصائح أو التوصيات المقدمة أو المعتمدة من TradingView. اقرأ المزيد في شروط الاستخدام.