OPEN-SOURCE SCRIPT
تم تحديثه CNN Fear and Greed Index
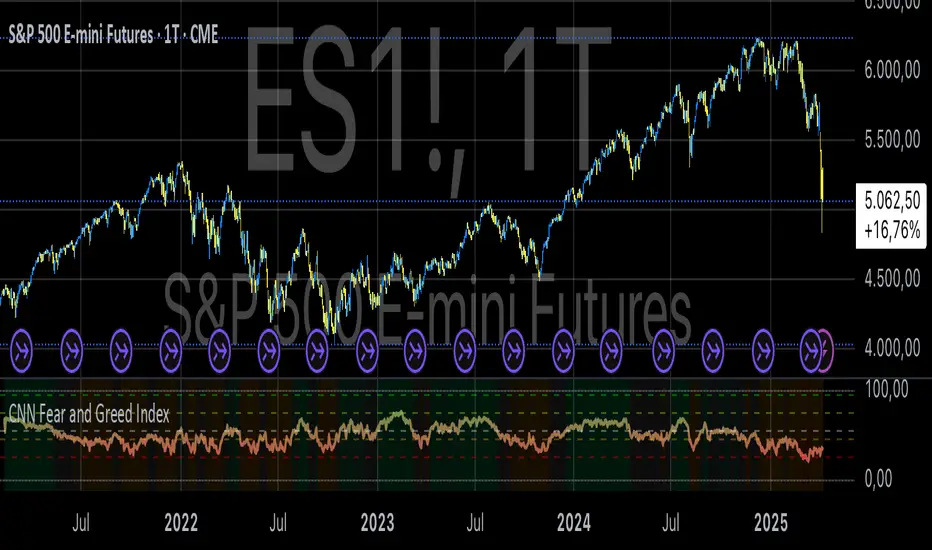
The “CNN Fear and Greed Index” indicator in this context is designed to gauge market sentiment based on a combination of several fundamental indicators. Here’s a breakdown of how this indicator works and what it represents:
Components of the Indicator:
1. Stock Price Momentum:
• Calculates the momentum of the S&P 500 index relative to its 125-day moving average. Momentum is essentially the rate of acceleration or deceleration of price movements over time.
2. Stock Price Strength:
• Measures the breadth of the market by comparing the number of stocks hitting 52-week highs versus lows. This provides insights into the overall strength or weakness of the market trend.
3. Stock Price Breadth:
• Evaluates the volume of shares trading on the rise versus the falling volume. Higher volume on rising days suggests positive market breadth, while higher volume on declining days indicates negative breadth.
4. Put and Call Options Ratio (Put/Call Ratio):
• This ratio indicates the sentiment of investors in the options market. A higher put/call ratio typically signals increased bearish sentiment (more puts relative to calls) and vice versa.
5. Market Volatility (VIX):
• Also known as the “fear gauge,” the VIX measures the expected volatility in the market over the next 30 days. Higher VIX values indicate higher expected volatility and often correlate with increased fear or uncertainty in the market.
6. Safe Haven Demand:
• Compares the returns of stocks (represented by S&P 500) versus safer investments like 10-year Treasury bonds. Higher returns on bonds relative to stocks suggest a flight to safety or risk aversion.
7. Junk Bond Demand:
• Measures the spread between yields on high-yield (junk) bonds and investment-grade bonds. Widening spreads may indicate increasing risk aversion as investors demand higher yields for riskier bonds.
Normalization and Weighting:
• Normalization: Each component is normalized to a scale of 0 to 100 using a function that adjusts the range based on historical highs and lows of the respective indicator.
• Weighting: The user can adjust the relative importance (weight) of each component using input parameters. This customization allows for different interpretations of market sentiment based on which factors are considered more influential.
Fear and Greed Index Calculation:
• The Fear and Greed Index is calculated as a weighted average of all normalized components. This index provides a single numerical value that summarizes the overall sentiment of the market based on the selected indicators.
Usage:
• Visualization: The indicator plots the Fear and Greed Index and its components on the chart. This allows traders and analysts to visually assess the sentiment trends over time.
• Analysis: Changes in the Fear and Greed Index can signal shifts in market sentiment. For example, a rising index may indicate increasing greed and potential overbought conditions, while a falling index may suggest increasing fear and potential oversold conditions.
• Customization: Traders can customize the indicator by adjusting the weights assigned to each component based on their trading strategies and market insights.
By integrating multiple fundamental indicators into a single index, the “CNN Fear and Greed Index” provides a comprehensive snapshot of market sentiment, helping traders make informed decisions about market entry, exit, and risk management strategies.
ملاحظات الأخبار
Changes and Improvements:• Pine Script Version Update: The new script uses version=6, providing access to the latest Pine Script features and optimizations.
• Dynamic Weighting: Weights are dynamically set based on CNN’s methodology, enhancing realism and accuracy compared to static user inputs in the previous script.
• Enhanced Calculations:
• Momentum now uses a ratio-based approach (sp500 / SMA - 1), making it more precise.
• Breadth incorporates a volume difference, reducing bias and enhancing signal quality.
• Put/Call Ratio and VIX use SMAs for smoothing, reducing noise.
• More Accurate Data Inputs: Junk bond demand now uses TLT for bond prices, a more accurate proxy.
• Longer Normalization Period: Extended from 252 days (1 year) to 756 days (3 years) for a more stable historical comparison.
• Improved Plotting and Visualization: New threshold lines for Extreme Fear and Extreme Greed, enhancing interpretability.
Why It’s Better:
The new script provides more accurate, stable, and realistic measurements by improving data inputs, smoothing, and extending historical analysis. This results in a more reliable CNN Fear and Greed Index for trading decisions.
ملاحظات الأخبار
Weights Adjustment: Changed from dynamic weights (1.2, 1.1, 1.3, etc.) to equal weights (all 1.0) to match the official CNN methodology.
Strength Calculation:
Now uses actual counts of stocks at 52-week highs/lows (INDEX:HIGN/LOWN) instead of S&P price extremes.
Breadth Indicator:
Implemented McClellan Volume Summation Index instead of simple volume difference, aligning with CNN's approach.
Time Periods:
Changed Put/Call ratio averaging from 5 to 10 days
Normalized over 250 days instead of 756 days (closer to CNN's timeframe)
Adjusted ROC periods for better accuracy
Visual Improvements:
Dynamic color gradient based on index value
Added neutral zone (45-55)
Defined zones with background colors
Adjusted thresholds (25-45-55-75-95 instead of 20-40-60-80)
Semi-transparent reference lines
Mathematical Precision:
Improved the final calculation formula, dividing by sum of weights instead of fixed value 7.
These changes make the indicator more accurate and visually informative while staying closer to CNN's original methodology.
The CNN Fear and Greed Index cannot be fully replicated in Pine Script due to limitations in data availability and transparency. Many of the components used by CNN—such as the exact number of stocks hitting 52-week highs and lows across all major U.S. exchanges, proprietary market breadth indicators, and detailed institutional sentiment measures—are not publicly available or accessible through TradingView’s data feeds. Additionally, CNN does not disclose the exact formulas, weightings, or smoothing methods it applies to each component. As a result, while a close approximation can be constructed using publicly available proxies like INDEX:HIGN, INDEX:LOWN, or FRED economic data, the script remains an estimate and may not match the official index values precisely.
نص برمجي مفتوح المصدر
بروح TradingView الحقيقية، قام مبتكر هذا النص البرمجي بجعله مفتوح المصدر، بحيث يمكن للمتداولين مراجعة وظائفه والتحقق منها. شكرا للمؤلف! بينما يمكنك استخدامه مجانًا، تذكر أن إعادة نشر الكود يخضع لقواعد الموقع الخاصة بنا.
Where others speculate, we systematize.
edgetools.org
edgetools.org
إخلاء المسؤولية
لا يُقصد بالمعلومات والمنشورات أن تكون، أو تشكل، أي نصيحة مالية أو استثمارية أو تجارية أو أنواع أخرى من النصائح أو التوصيات المقدمة أو المعتمدة من TradingView. اقرأ المزيد في شروط الاستخدام.