OPEN-SOURCE SCRIPT
Long Short Momentum
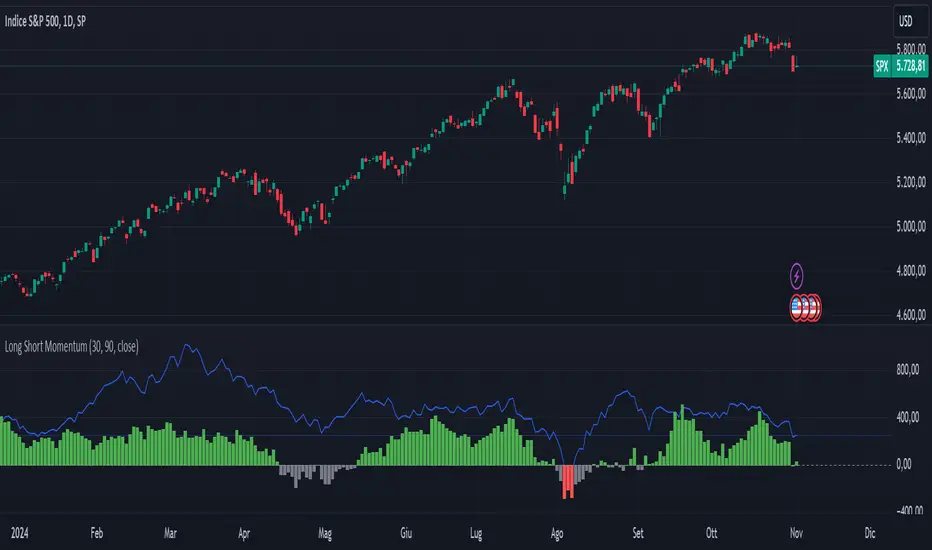
This indicator is designed to visualize short-term and long-term momentum trends.The indicator calculates two momentum lines based on customizable lengths: a short momentum (Short Momentum) over a smaller period and a long momentum (Long Momentum) over a longer period. These lines are plotted relative to the chosen price source, typically the closing price.
The histogram, colored dynamically based on momentum direction, gives visual cues:
The histogram, colored dynamically based on momentum direction, gives visual cues:
- Green: Both short and long momentum are positive, indicating an upward trend.
- Red: Both are negative, indicating a downward trend.
- Gray: Mixed momentum, suggesting potential trend indecision.
نص برمجي مفتوح المصدر
بروح TradingView الحقيقية، قام مبتكر هذا النص البرمجي بجعله مفتوح المصدر، بحيث يمكن للمتداولين مراجعة وظائفه والتحقق منها. شكرا للمؤلف! بينما يمكنك استخدامه مجانًا، تذكر أن إعادة نشر الكود يخضع لقواعد الموقع الخاصة بنا.
إخلاء المسؤولية
لا يُقصد بالمعلومات والمنشورات أن تكون، أو تشكل، أي نصيحة مالية أو استثمارية أو تجارية أو أنواع أخرى من النصائح أو التوصيات المقدمة أو المعتمدة من TradingView. اقرأ المزيد في شروط الاستخدام.