INVITE-ONLY SCRIPT
W Closes [Intromoto]

It's kind of annoying no having a reference of higher time frames when trading intraday.
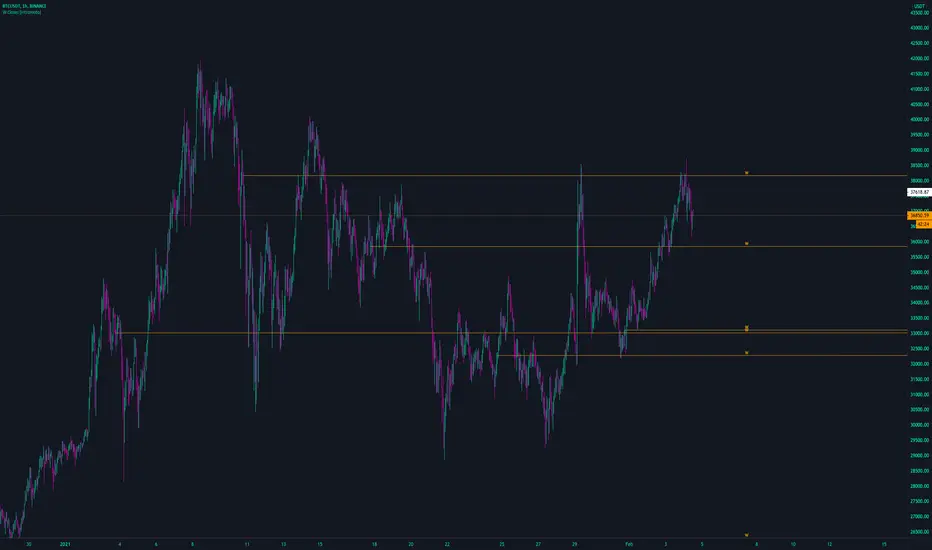
This script is one level from the "closes" script, but as an individual script, this allows more historical closes to be observed at once.
Shows weekly closes from the exact candle, regardless of time frame.
Number of lines plotted is limited by tradingview/pinescript, show will only show a certain number i.e recent weekly levels.
Lines can be styled by user: Thickness, solid vs dotted vs dashed, range of colors, label size and X location.
The "line.new" function requires that you 'show' the indicator where the close occured, in order to have the line show. The labels are there regardless and will remind you of the level, with or without the line. This is also true if you change chart resolution. You may have to 'search' for the close to have the line show up.
DM for access.
Thanks!
نص برمجي للمستخدمين المدعوين فقط
الوصول إلى هذا النص مقيد للمستخدمين المصرح لهم من قبل المؤلف وعادة ما يكون الدفع مطلوباً. يمكنك إضافته إلى مفضلاتك، لكن لن تتمكن من استخدامه إلا بعد طلب الإذن والحصول عليه من مؤلفه. تواصل مع Intromoto للحصول على مزيد من المعلومات، أو اتبع إرشادات المؤلف أدناه.
لا تقترح TradingView الدفع مقابل النصوص البرمجية واستخدامها حتى تثق بنسبة 100٪ في مؤلفها وتفهم كيفية عملها. في كثير من الحالات، يمكنك العثور على بديل جيد مفتوح المصدر مجانًا في نصوص مجتمع الخاصة بنا .
تعليمات المؤلف
″
هل تريد استخدام هذا النص البرمجي على الرسم البياني؟
تحذير: يرجى القراءة قبل طلب الوصول.
DM for access.
Follow on Twitter for updates.
One time fee, no subscription
twitter.com/IntroMoto
Follow on Twitter for updates.
One time fee, no subscription
twitter.com/IntroMoto
إخلاء المسؤولية
لا يُقصد بالمعلومات والمنشورات أن تكون، أو تشكل، أي نصيحة مالية أو استثمارية أو تجارية أو أنواع أخرى من النصائح أو التوصيات المقدمة أو المعتمدة من TradingView. اقرأ المزيد في شروط الاستخدام.