OPEN-SOURCE SCRIPT
Spread Analysis (COIN/BTC)
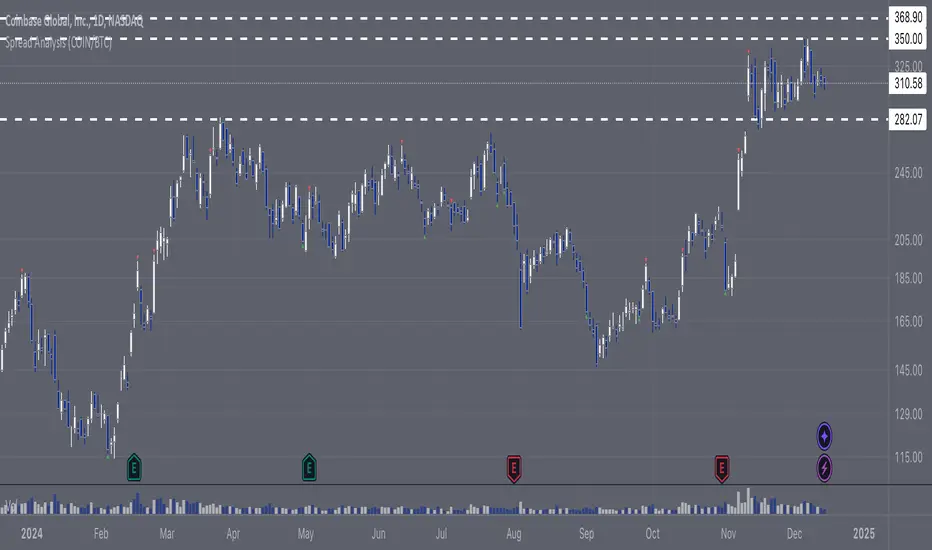
The Spread Analysis (COIN/BTC) indicator calculates the Z-score of the price ratio between Coinbase stock ( COIN) and Bitcoin (
 BTC). It helps identify overbought or oversold conditions based on deviations from the historical mean of their price relationship.
Key Features:
Z-Score Calculation:
• Tracks the relative price ratio ofCOIN to $BTC.
• Compares the current ratio to its historical average, highlighting extreme overvaluation or undervaluation.
• Buy and Sell Signals:
• Buy Signal: Triggered when the Z-score is less than -2, indicatingCOIN may be undervalued relative to $BTC.
• Sell Signal: Triggered when the Z-score exceeds 2, suggestingCOIN may be overvalued relative to $BTC.
• Dynamic Z-Score Visualization:
• Blue line plots the Z-score over time.
• Dashed lines at +2 and -2 mark overbought and oversold thresholds.
• Green and red triangles highlight actionable buy and sell signals.
Use Case:
This indicator is ideal for identifying relative valuation opportunities betweenCOIN and $BTC. Use it to exploit divergences in their historical relationship and anticipate potential reversions to the mean.
Limitations:
• Best suited for range-bound markets; may produce false signals in strongly trending conditions.
• Assumes a consistent correlation betweenCOIN and BTC, which may break during independent price drivers like news or earnings.
Key Features:
Z-Score Calculation:
• Tracks the relative price ratio of
• Compares the current ratio to its historical average, highlighting extreme overvaluation or undervaluation.
• Buy and Sell Signals:
• Buy Signal: Triggered when the Z-score is less than -2, indicating
• Sell Signal: Triggered when the Z-score exceeds 2, suggesting
• Dynamic Z-Score Visualization:
• Blue line plots the Z-score over time.
• Dashed lines at +2 and -2 mark overbought and oversold thresholds.
• Green and red triangles highlight actionable buy and sell signals.
Use Case:
This indicator is ideal for identifying relative valuation opportunities between
Limitations:
• Best suited for range-bound markets; may produce false signals in strongly trending conditions.
• Assumes a consistent correlation between
نص برمجي مفتوح المصدر
بروح TradingView الحقيقية، قام مبتكر هذا النص البرمجي بجعله مفتوح المصدر، بحيث يمكن للمتداولين مراجعة وظائفه والتحقق منها. شكرا للمؤلف! بينما يمكنك استخدامه مجانًا، تذكر أن إعادة نشر الكود يخضع لقواعد الموقع الخاصة بنا.
إخلاء المسؤولية
لا يُقصد بالمعلومات والمنشورات أن تكون، أو تشكل، أي نصيحة مالية أو استثمارية أو تجارية أو أنواع أخرى من النصائح أو التوصيات المقدمة أو المعتمدة من TradingView. اقرأ المزيد في شروط الاستخدام.