OPEN-SOURCE SCRIPT
تم تحديثه Previous Day High and Low Count with Probabilities
Indicator Explanation
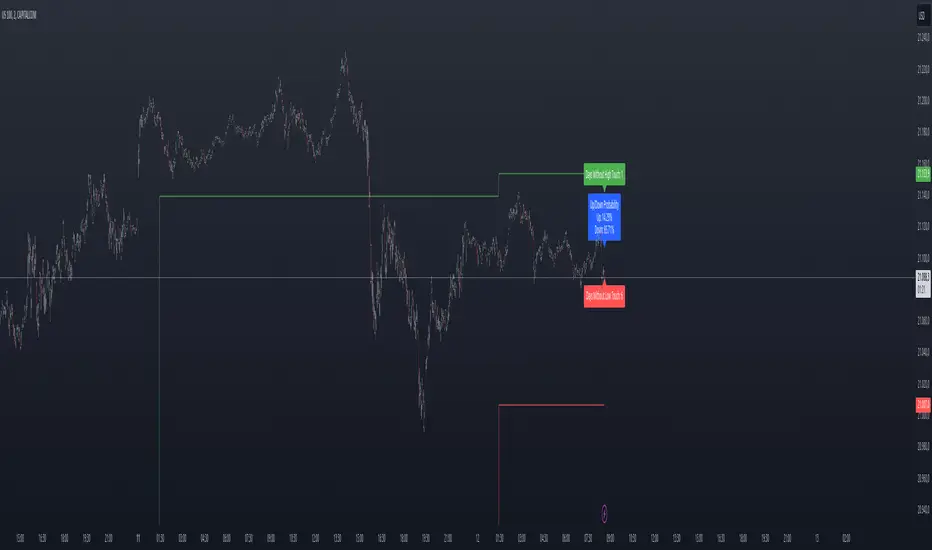
This indicator displays the number of days on which the previous day's high or low prices were not reached and calculates probabilities for future price movements based on this information. It stores the high and low values of the last 45 days and checks daily whether these levels were touched. Based on the number of days without touching either the high or the low, the indicator calculates the probability of future price movements in either direction (Up or Down).
The indicator offers customization options for label placement and color on the chart. The counts for the high and low touches, along with the calculated probabilities (in percentages), are displayed as labels on the chart. These labels can be shifted along the X-axis by up to 50 bars and can be customized in color and size. Additionally, the text for the labels can be freely chosen, giving the user improved flexibility and overview.
In summary, this indicator helps to:
- Track how often previous day's high and low levels were not reached.
- Estimate probabilities for future price movements based on this information.
- Customize the chart display for easier interpretation.
Strategy Concept
Probability and Touch Conditions:
A long position is entered only if:
The probability of reaching the high is at least 60%.
The price has not touched the previous day’s high in the last three days.
Similarly, for short positions:
The probability of reaching the low is at least 60%.
The price has not touched the previous day’s low in the last three days.
Incremental Position Size Increase:
On the 3rd consecutive day without a high/low touch and with the probability condition met, an initial position of 0.01 lots is opened.
On the 4th day, an additional position of 0.01 lots is added.
On the 5th day, an extra position of 0.02 lots is opened.
After a two-day pause, the situation is re-evaluated, and if conditions are still met, a 0.04-lot position is considered.
Trend Reversal Detection:
The strategy also includes a simple trend reversal check. If the market shows clear reversal signals, no new positions will be opened.
Adjustments and Risk Management
This strategy can be adjusted by modifying the probability values, the number of days without a high/low touch, and the lot sizes. Additionally, stop-loss and take-profit levels can be added to further control the risk and secure profits.
Strategy Concept
Probability and Touch Conditions:
A long position is entered only if:
The probability of reaching the high is at least 60%.
The price has not touched the previous day’s high in the last three days.
Similarly, for short positions:
The probability of reaching the low is at least 60%.
The price has not touched the previous day’s low in the last three days.
Incremental Position Size Increase:
On the 3rd consecutive day without a high/low touch and with the probability condition met, an initial position of 0.01 lots is opened.
On the 4th day, an additional position of 0.01 lots is added.
On the 5th day, an extra position of 0.02 lots is opened.
After a two-day pause, the situation is re-evaluated, and if conditions are still met, a 0.04-lot position is considered.
Trend Reversal Detection:
The strategy also includes a simple trend reversal check. If the market shows clear reversal signals, no new positions will be opened.
Risk Disclaimer
The author of this strategy does not assume any liability for potential losses or gains that may arise from the use of this strategy. Trading involves significant risk, and it is important to only trade with capital that you can afford to lose. The strategy presented is for educational purposes only and should not be considered as financial advice. Always conduct your own research and consider seeking advice from a professional financial advisor before making any trading decisions.
ملاحظات الأخبار
Indicator Explanation
This indicator displays the number of days on which the previous day's high or low prices were not reached and calculates probabilities for future price movements based on this information. It stores the high and low values of the last 45 days and checks daily whether these levels were touched. Based on the number of days without touching either the high or the low, the indicator calculates the probability of future price movements in either direction (Up or Down).
The indicator offers customization options for label placement and color on the chart. The counts for the high and low touches, along with the calculated probabilities (in percentages), are displayed as labels on the chart. These labels can be shifted along the X-axis by up to 50 bars and can be customized in color and size. Additionally, the text for the labels can be freely chosen, giving the user improved flexibility and overview.
In summary, this indicator helps to:
- Track how often previous day's high and low levels were not reached.
- Estimate probabilities for future price movements based on this information.
- Customize the chart display for easier interpretation.
Strategy Concept
Probability and Touch Conditions:
A long position is entered only if:
The probability of reaching the high is at least 60%.
The price has not touched the previous day’s high in the last three days.
Similarly, for short positions:
The probability of reaching the low is at least 60%.
The price has not touched the previous day’s low in the last three days.
Incremental Position Size Increase:
On the 3rd consecutive day without a high/low touch and with the probability condition met, an initial position of 0.01 lots is opened.
On the 4th day, an additional position of 0.01 lots is added.
On the 5th day, an extra position of 0.02 lots is opened.
After a two-day pause, the situation is re-evaluated, and if conditions are still met, a 0.04-lot position is considered.
Trend Reversal Detection:
The strategy also includes a simple trend reversal check. If the market shows clear reversal signals, no new positions will be opened.
Adjustments and Risk Management
This strategy can be adjusted by modifying the probability values, the number of days without a high/low touch, and the lot sizes. Additionally, stop-loss and take-profit levels can be added to further control the risk and secure profits.
Strategy Concept
Probability and Touch Conditions:
A long position is entered only if:
The probability of reaching the high is at least 60%.
The price has not touched the previous day’s high in the last three days.
Similarly, for short positions:
The probability of reaching the low is at least 60%.
The price has not touched the previous day’s low in the last three days.
Incremental Position Size Increase:
On the 3rd consecutive day without a high/low touch and with the probability condition met, an initial position of 0.01 lots is opened.
On the 4th day, an additional position of 0.01 lots is added.
On the 5th day, an extra position of 0.02 lots is opened.
After a two-day pause, the situation is re-evaluated, and if conditions are still met, a 0.04-lot position is considered.
Trend Reversal Detection:
The strategy also includes a simple trend reversal check. If the market shows clear reversal signals, no new positions will be opened.
Risk Disclaimer
The author of this strategy does not assume any liability for potential losses or gains that may arise from the use of this strategy. Trading involves significant risk, and it is important to only trade with capital that you can afford to lose. The strategy presented is for educational purposes only and should not be considered as financial advice. Always conduct your own research and consider seeking advice from a professional financial advisor before making any trading decisions.
Update 12.11.2024
Summary of bug fixes and improvements:
The counter logic has been improved by correctly using highTouched and lowTouched so that the counter is only incremented if the previous day's high or low is not touched.
The label initialization and update has been adjusted to fix the previous bugs and display the labels correctly in the chart.
User customizations for label colors, positions and font sizes have been added to improve the visualization.
These changes and enhancements ensure that the script works correctly and is user-friendly and customizable!
ملاحظات الأخبار
1. Stable Counting LogicPreviously, your Daily High/Low counter sometimes reset randomly because the logic was based on touching only a single value or updating at the wrong time.
In the updated script:
Two counters are used: countHighD and countLowD.
Each counter increases by 1 for each new day if the current day’s close has not touched any previous highs or lows stored in the last 45 days.
If the close touches or exceeds a previous high/low, the respective counter is reset to 0.
This ensures the counters are stable and predictable.
2. Probabilities
The Up/Down probabilities are calculated as:
UpProbability
=
countHighD
countHighD + countLowD
×
100
UpProbability=
countHighD + countLowD
countHighD
×100
DownProbability
=
countLowD
countHighD + countLowD
×
100
DownProbability=
countHighD + countLowD
countLowD
×100
If no counts exist yet, probabilities are set to na to avoid division errors.
Probabilities update only at the start of a new day, keeping values consistent during the day.
3. Label Updates
Labels (highLabel, lowLabel, probLabel) are created once and then updated every new bar.
Text, position, and colors are updated dynamically.
This prevents creating multiple overlapping labels and ensures a clean chart display.
4. Arrays for Reference
Arrays highArray and lowArray store the previous 45 daily highs and lows.
Each day, the oldest value is removed if the array exceeds 45 entries.
This allows checking against multiple previous highs/lows rather than just the last day.
5. Optional Plot
The previous day’s high and low are plotted as lines on the chart for a visual reference.
This helps to see at a glance if the current price touches past highs/lows.
نص برمجي مفتوح المصدر
بروح TradingView الحقيقية، قام مبتكر هذا النص البرمجي بجعله مفتوح المصدر، بحيث يمكن للمتداولين مراجعة وظائفه والتحقق منها. شكرا للمؤلف! بينما يمكنك استخدامه مجانًا، تذكر أن إعادة نشر الكود يخضع لقواعد الموقع الخاصة بنا.
إخلاء المسؤولية
لا يُقصد بالمعلومات والمنشورات أن تكون، أو تشكل، أي نصيحة مالية أو استثمارية أو تجارية أو أنواع أخرى من النصائح أو التوصيات المقدمة أو المعتمدة من TradingView. اقرأ المزيد في شروط الاستخدام.