PROTECTED SOURCE SCRIPT
Volume Density by EmreKb
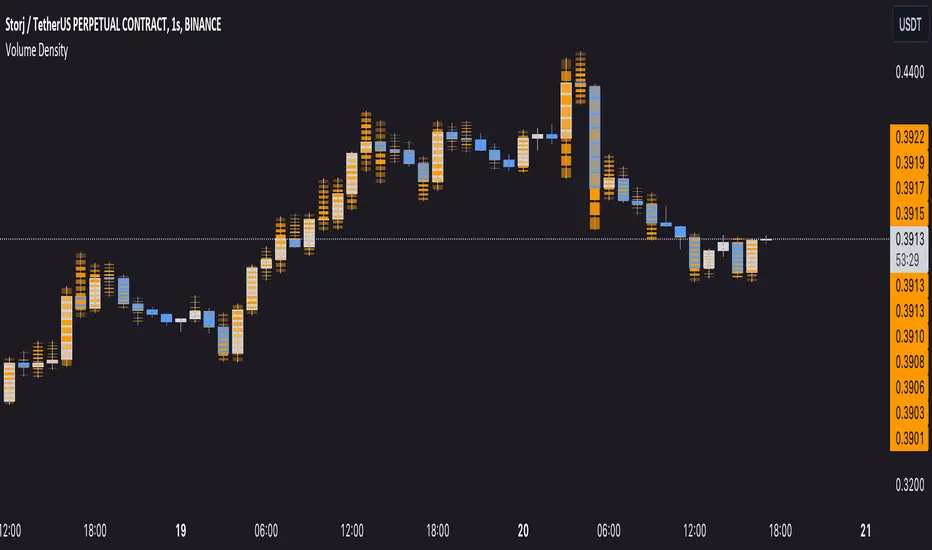
This indicator allows you to assess price levels within a single candle based on volume distribution. It visually represents areas with higher volume density as more intense in color, while areas with lower volume density appear more transparent.
The indicator computes volume intensity for larger time frame candles by analyzing the prices and volumes of 1-minute time frame candles, providing valuable insights into volume patterns
The indicator computes volume intensity for larger time frame candles by analyzing the prices and volumes of 1-minute time frame candles, providing valuable insights into volume patterns
نص برمجي محمي
تم نشر هذا النص البرمجي كمصدر مغلق. ومع ذلك، يمكنك استخدامه بحرية ودون أي قيود - تعرف على المزيد هنا.
إخلاء المسؤولية
لا يُقصد بالمعلومات والمنشورات أن تكون، أو تشكل، أي نصيحة مالية أو استثمارية أو تجارية أو أنواع أخرى من النصائح أو التوصيات المقدمة أو المعتمدة من TradingView. اقرأ المزيد في شروط الاستخدام.