WhaleCrew Overlay
Features
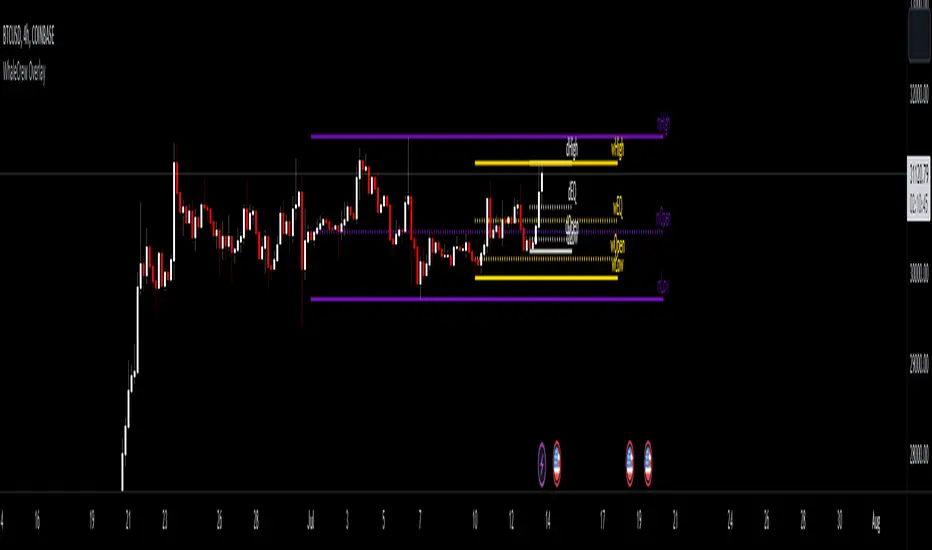
- Support and Resistance
- Trend Visualization
- Fib Ribbons
- Moving Average System
- Intraday Tools
Support and Resistance
This involves Daily Levels (High, Low, Open, and Range Center), Weekly Levels (Open, High and Low), as well as the Monthly/Quarterly/Yearly Open.
Automatically having these support/resistance levels on your chart no matter what timeframe you're on is a big advantage, they can be used as confluence levels for potential trades.
Trend Visualization
Our trend component visualizes the current trend using two moving averages. There are multiple inbuilt modes that should be picked based on your trading style.
Use this indicator as confluence and don't rely solely on it.
Fib Ribbons
Our Fib Ribbons are a bundle of multiple EMAs with custom timeframe built-in. Unlike EMA Ribbons our EMA lengths are only based on Fibonacci Numbers.
The numbers of EMAs is four by default (fastest: 8, slowest: 34), but EMA 5 & 55 can be manually enabled.
The ribbons will act as support in an uptrend and as resistance in a downtrend. A ribbon cross often indicates a potential trend change.
Moving Average System
Build a system around 2 custom moving averages for more confluence (supports custom timeframes and many moving average types).
The moving averages can be used for generating signals whenever they cross, or as possible support/resistance.
Intraday Tools
We also support intraday tools like VWAP (Volume-Weighted-Average Price) and TWAP (Time-Weighted-Average-Price).
They differ from normal moving averages by taking volume/time into account and will act as potential support/resistance (commonly used by big market participants).
Usage
You should look for price levels where moving averages and support/resistance are lined up for confluence.
Closely monitor price action near important price levels for potential trade setups:
- Consolidation right below resistance is considered bullish
- Consolidation right at support might be considered bearish
- Watch out for rejections and retests (also counts for moving averages)
Access to this indicator can be obtained through our website.
-fixed dynamic SR levels (daily high/low and range center)
-removed weekly high/low
-adjusted default colors of daily/quarterly/yearly open
نص برمجي للمستخدمين المدعوين فقط
Only users approved by the author can access this script. You'll need to request and get permission to use it. This is typically granted after payment. For more details, follow the author's instructions below or contact WhaleCrew directly.
TradingView does NOT recommend paying for or using a script unless you fully trust its author and understand how it works. You may also find free, open-source alternatives in our community scripts.
تعليمات المؤلف
إخلاء المسؤولية
نص برمجي للمستخدمين المدعوين فقط
Only users approved by the author can access this script. You'll need to request and get permission to use it. This is typically granted after payment. For more details, follow the author's instructions below or contact WhaleCrew directly.
TradingView does NOT recommend paying for or using a script unless you fully trust its author and understand how it works. You may also find free, open-source alternatives in our community scripts.