INVITE-ONLY SCRIPT
Kovach Reversals

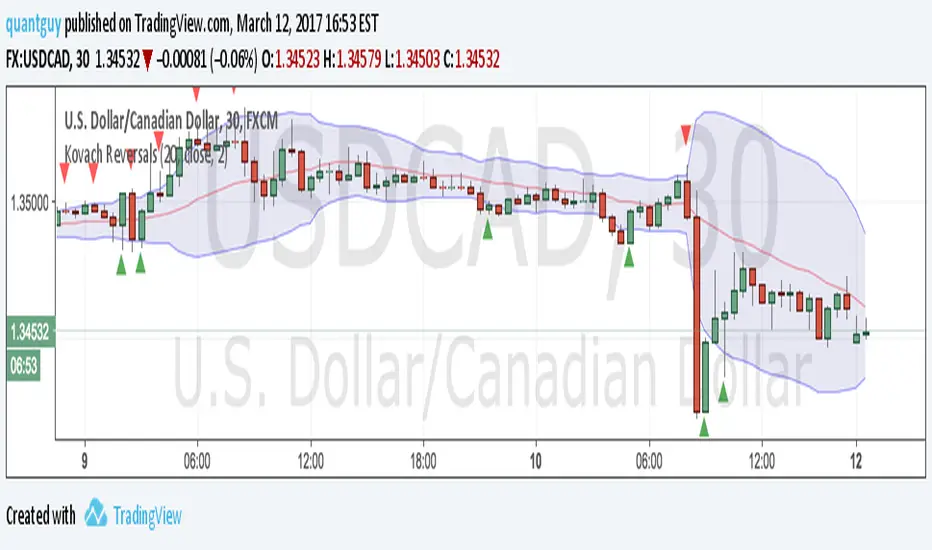
With the Kovach Reversals indicator, we automate the process of scanning for technical candlestick reversal patterns. A bearish reversal is shown by a red triangle above the high of the most recent candlestick in the pattern, a green triangle indicates a bullish reversal. To mitigate false positives, we filter for the reversal patterns at the extrema of the price range, where a reversal is highly likely to occur. While many indicators are susceptible to time lag, the reversals are drawn instantaneously as the bar forms, giving you the ability to get in on a trade as the setup develops.
This indicator works best with the Kovach Momentum, Kovach Chande, or Kovach OBV indicators, where we can leverage the strengths of both to increase our probability of success.
This indicator works best with the Kovach Momentum, Kovach Chande, or Kovach OBV indicators, where we can leverage the strengths of both to increase our probability of success.
نص برمجي للمستخدمين المدعوين فقط
الوصول إلى هذا النص مقيد للمستخدمين المصرح لهم من قبل المؤلف وعادة ما يكون الدفع مطلوباً. يمكنك إضافته إلى مفضلاتك، لكن لن تتمكن من استخدامه إلا بعد طلب الإذن والحصول عليه من مؤلفه. تواصل مع quantguy للحصول على مزيد من المعلومات، أو اتبع إرشادات المؤلف أدناه.
لا تقترح TradingView الدفع مقابل النصوص البرمجية واستخدامها حتى تثق بنسبة 100٪ في مؤلفها وتفهم كيفية عملها. في كثير من الحالات، يمكنك العثور على بديل جيد مفتوح المصدر مجانًا في نصوص مجتمع الخاصة بنا .
تعليمات المؤلف
″
هل تريد استخدام هذا النص البرمجي على الرسم البياني؟
تحذير: يرجى القراءة قبل طلب الوصول.
Join my discord at discord.io/quantguy
إخلاء المسؤولية
لا يُقصد بالمعلومات والمنشورات أن تكون، أو تشكل، أي نصيحة مالية أو استثمارية أو تجارية أو أنواع أخرى من النصائح أو التوصيات المقدمة أو المعتمدة من TradingView. اقرأ المزيد في شروط الاستخدام.