OPEN-SOURCE SCRIPT
تم تحديثه Dynamic S/R Levels: Edge Finder
Overview
The Dynamic S/R Levels: Edge Finder indicator is designed to identify dynamic support and resistance levels based on historical price action. It uses a combination of price extremes (highs and lows) over user-defined lookback periods, weighted moving averages (WMAs), and touch-count analysis to provide actionable insights into key market levels.
This tool is ideal for traders who want to:
Identify dynamic support and resistance zones.
Understand the strength of these levels based on price touches.
Make informed decisions using clear, adaptive levels.
How It Works
Dynamic Levels Calculation:
The indicator calculates dynamic support levels using the lowest lows and dynamic resistance levels using the highest highs over user-defined lookback periods (e.g., 20, 40, 60 bars, etc.).
These levels are updated dynamically as new price data becomes available.
Touch Count Analysis:
The indicator counts how many times the price has touched or come close to each support/resistance level within the lookback period.
Levels with more touches are considered stronger and are highlighted accordingly.
Weighted Moving Averages (WMAs):
The indicator uses 50-period and 100-period WMAs to identify the closest support/resistance levels to the current trend.
Levels near these WMAs are given additional weight, as they are more likely to act as significant barriers.
Level Merging:
If two support or resistance levels are too close to each other (based on the minimum distance percentage), the weaker level (with fewer touches) is removed to avoid clutter.
Visualization:
Support levels are displayed as dashed red lines, and resistance levels are displayed as dashed blue lines.
Each level is labeled with its corresponding touch count, allowing traders to quickly assess its strength.
How to Interpret the Indicator
Strong Support/Resistance Levels:
Levels with higher touch counts (e.g., 5, 10, or more) are considered stronger and are more likely to hold in the future.
Use these levels to plan entries, exits, or stop-loss placements.
Proximity to WMAs:
Levels closest to the 50-period or 100-period WMA are more significant, especially in trending markets.
These levels often act as dynamic barriers where price reactions are more likely.
Breakouts and Rejections:
If the price breaks through a strong resistance level, it may indicate a potential bullish trend.
If the price rejects a strong support level, it may indicate a potential bearish trend.
Always confirm breakouts or rejections with additional analysis (e.g., volume, candlestick patterns).
Level Merging:
Merged levels indicate areas of high confluence, where multiple support/resistance zones overlap.
These areas are particularly important for decision-making, as they represent stronger market reactions.
Key Features
Customizable Lookback Periods: Adjust the lookback periods for each dynamic level to suit your trading style.
Touch Count Labels: Quickly identify the strength of each level based on the number of price touches.
Adaptive Levels: The indicator dynamically updates levels based on recent price action.
Clean Visualization: Levels are automatically merged to avoid clutter and provide a clear view of the market structure.
Usage Tips
Trend Identification: Combine the indicator with trend-following tools (e.g., moving averages, trendlines) to confirm the overall market direction.
Risk Management: Use the identified levels to set stop-loss orders or take-profit targets.
Timeframe Flexibility: The indicator works on all timeframes, but it is particularly effective on higher timeframes (e.g., 1H, 4H, Daily) for more reliable levels.
Example Scenarios
Bounce Trade:
If the price approaches a strong support level (high touch count) and shows signs of rejection (e.g., bullish candlestick patterns), consider a long position with a stop-loss below the support level.
Breakout Trade:
If the price breaks above a strong resistance level with high volume, consider a long position with a target at the next resistance level.
Range-Bound Market:
In a sideways market, use the support and resistance levels to identify range boundaries and trade bounces between them.
Disclaimer
Dynamic S/R Levels: Edge Finder is a technical analysis tool designed to identify dynamic support and resistance levels based on historical price action. It is intended for informational and educational purposes only. This indicator does not provide financial, investment, or trading advice. Users are solely responsible for their trading decisions and should conduct their own research and analysis before making any trades. The developer of this tool is not liable for any financial losses or damages resulting from the use of this indicator. Trading in financial markets involves risk, and you should only trade with capital you can afford to lose.
ملاحظات الأخبار
OverviewThe Dynamic S/R Levels: Edge Finder indicator is designed to identify dynamic support and resistance levels based on historical price action. It uses a combination of price extremes (highs and lows) over user-defined lookback periods, weighted moving averages (WMAs), and touch-count analysis to provide actionable insights into key market levels.
This tool is ideal for traders who want to:
Identify dynamic support and resistance zones.
Understand the strength of these levels based on price touches.
Make informed decisions using clear, adaptive levels.
How It Works
Dynamic Levels Calculation:
The indicator calculates dynamic support levels using the lowest lows and dynamic resistance levels using the highest highs over user-defined lookback periods (e.g., 20, 40, 60 bars, etc.).
These levels are updated dynamically as new price data becomes available.
Touch Count Analysis:
The indicator counts how many times the price has touched or come close to each support/resistance level within the lookback period.
Levels with more touches are considered stronger and are highlighted accordingly.
Weighted Moving Averages (WMAs):
The indicator uses 50-period and 100-period WMAs to identify the closest support/resistance levels to the current trend.
Levels near these WMAs are given additional weight, as they are more likely to act as significant barriers.
Level Merging:
If two support or resistance levels are too close to each other (based on the minimum distance percentage), the weaker level (with fewer touches) is removed to avoid clutter.
Visualization:
Support levels are displayed as dashed red lines, and resistance levels are displayed as dashed blue lines.
Each level is labeled with its corresponding touch count, allowing traders to quickly assess its strength.
How to Interpret the Indicator
Strong Support/Resistance Levels:
Levels with higher touch counts (e.g., 5, 10, or more) are considered stronger and are more likely to hold in the future.
Use these levels to plan entries, exits, or stop-loss placements.
Proximity to WMAs:
Levels closest to the 50-period or 100-period WMA are more significant, especially in trending markets.
These levels often act as dynamic barriers where price reactions are more likely.
Breakouts and Rejections:
If the price breaks through a strong resistance level, it may indicate a potential bullish trend.
If the price rejects a strong support level, it may indicate a potential bearish trend.
Always confirm breakouts or rejections with additional analysis (e.g., volume, candlestick patterns).
Level Merging:
Merged levels indicate areas of high confluence, where multiple support/resistance zones overlap.
These areas are particularly important for decision-making, as they represent stronger market reactions.
Key Features
Customizable Lookback Periods: Adjust the lookback periods for each dynamic level to suit your trading style.
Touch Count Labels: Quickly identify the strength of each level based on the number of price touches.
Adaptive Levels: The indicator dynamically updates levels based on recent price action.
Clean Visualization: Levels are automatically merged to avoid clutter and provide a clear view of the market structure.
Usage Tips
Trend Identification: Combine the indicator with trend-following tools (e.g., moving averages, trendlines) to confirm the overall market direction.
Risk Management: Use the identified levels to set stop-loss orders or take-profit targets.
Timeframe Flexibility: The indicator works on all timeframes, but it is particularly effective on higher timeframes (e.g., 1H, 4H, Daily) for more reliable levels.
Example Scenarios
Bounce Trade:
If the price approaches a strong support level (high touch count) and shows signs of rejection (e.g., bullish candlestick patterns), consider a long position with a stop-loss below the support level.
Breakout Trade:
If the price breaks above a strong resistance level with high volume, consider a long position with a target at the next resistance level.
Range-Bound Market:
In a sideways market, use the support and resistance levels to identify range boundaries and trade bounces between them.
Disclaimer
Dynamic S/R Levels: Edge Finder is a technical analysis tool designed to identify dynamic support and resistance levels based on historical price action. It is intended for informational and educational purposes only. This indicator does not provide financial, investment, or trading advice. Users are solely responsible for their trading decisions and should conduct their own research and analysis before making any trades. The developer of this tool is not liable for any financial losses or damages resulting from the use of this indicator. Trading in financial markets involves risk, and you should only trade with capital you can afford to lose.
Update Notes:
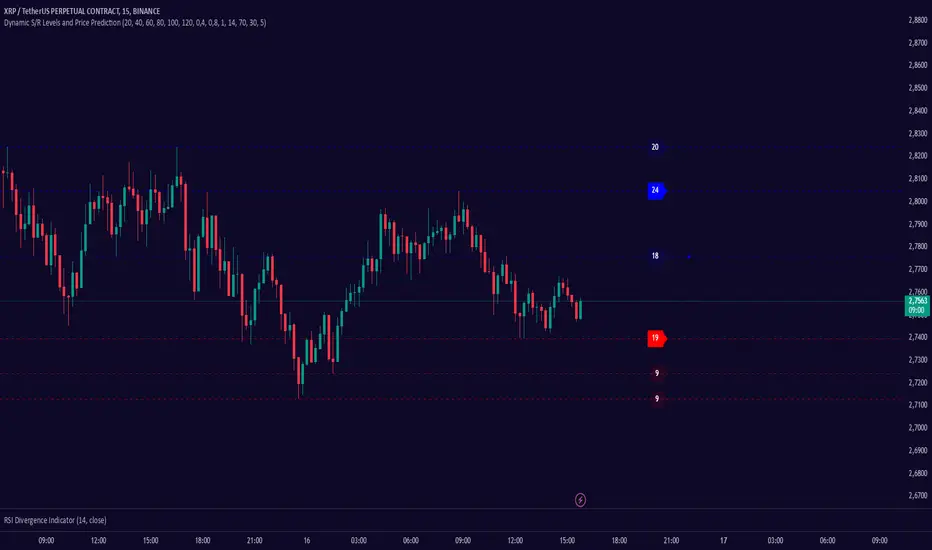
Weighted Moving Average (WMA) Relationship:
A blue dot has been added to the support or resistance levels that are closest to the 50-period and 100-period Weighted Moving Average (WMA) values. These dots visually highlight the relationship between moving averages and key support/resistance levels, particularly emphasizing significant dynamic levels during trending markets.
RSI Overbought/Oversold Conditions:
When the Relative Strength Index (RSI) is in overbought or oversold zones, additional points are assigned to the relevant support or resistance levels. These conditions are indicated by a green upward arrow (▲) for oversold levels and a red downward arrow (▼) for overbought levels. These arrows visually represent the relationship between RSI extremes and support/resistance levels.
Visual Improvements:
Support and resistance levels have been merged for a cleaner and more intuitive display, removing unnecessary clutter. Additionally, touch counts (indicating the strength of each level) are displayed alongside labels for better interpretation.
This update enhances the effectiveness of analyzing and interpreting dynamic support and resistance levels, providing traders with clearer insights into key market levels.
ملاحظات الأخبار
Added alert and signal functions to improve trading automation and decision-making.Optimized entry and exit conditions for better signal accuracy and trade execution.
Improved support and resistance detection for more reliable trade opportunities.
نص برمجي مفتوح المصدر
بروح TradingView الحقيقية، قام مبتكر هذا النص البرمجي بجعله مفتوح المصدر، بحيث يمكن للمتداولين مراجعة وظائفه والتحقق منها. شكرا للمؤلف! بينما يمكنك استخدامه مجانًا، تذكر أن إعادة نشر الكود يخضع لقواعد الموقع الخاصة بنا.
إخلاء المسؤولية
لا يُقصد بالمعلومات والمنشورات أن تكون، أو تشكل، أي نصيحة مالية أو استثمارية أو تجارية أو أنواع أخرى من النصائح أو التوصيات المقدمة أو المعتمدة من TradingView. اقرأ المزيد في شروط الاستخدام.