PROTECTED SOURCE SCRIPT
Relative Strength Index With Signals [ChuckBanger]
Every developer should have there own Relative Strength Index indicator. This is my version. Relative Strength Index or RSI is the most used indicator. It is an momentum based oscillator which is used to measure the velocity as well as the change of direction of price action. Essentially RSI provides a visual mean to monitor both the current, as well as historical, strength and weakness of the market you trade. RSI is calculated as folowing: RSI = 100 – 100/ (1 + RS) where RS = Average Gain of n days UP / Average Loss of n days DOWN.
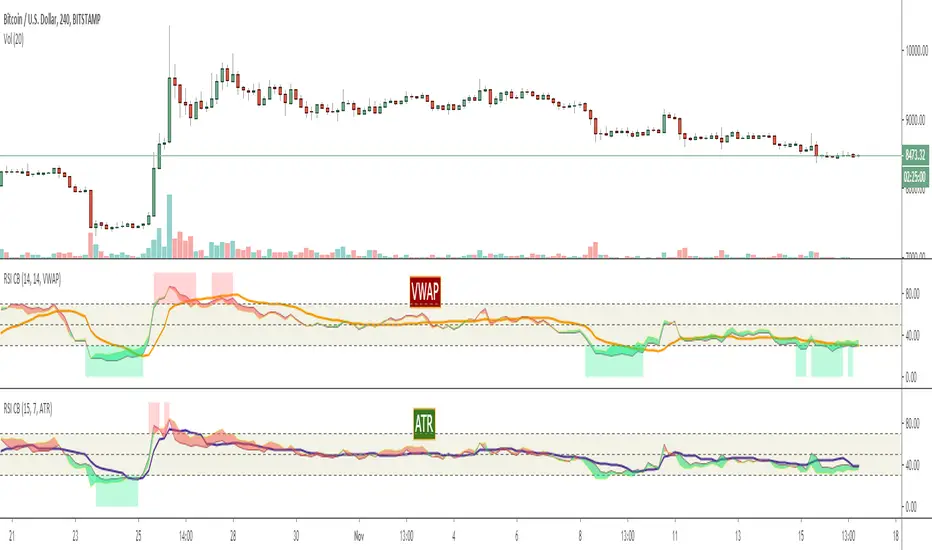
In this study RSI is weighted with ether VWAP (volume-weighted average price) or ATR (Average True Range). The user can select that through the menu. RSI can have a reading from 0 to 100. The values of 70 or above indicate that an instrument is becoming overbought or overvalued and may be primed for a trend reversal or corrective pullback in price. The values of 30 or below indicates an oversold or undervalued condition.
The other significant signals are divergences with price and middle line crossovers. This version also has a signal line witch can be used as a signal when RSI crossover
نص برمجي محمي
تم نشر هذا النص البرمجي كمصدر مغلق. ومع ذلك، يمكنك استخدامه بحرية ودون أي قيود - تعرف على المزيد هنا.
Tip jar, if you want to support my indicators work
BTC: 3EV8QGKK689kToo1r8pZJXbWDqzyJQtHy6
LTC: LRAikFVtnqY2ScJUR2ETJSG4w9t8LcmSdh
BTC: 3EV8QGKK689kToo1r8pZJXbWDqzyJQtHy6
LTC: LRAikFVtnqY2ScJUR2ETJSG4w9t8LcmSdh
إخلاء المسؤولية
لا يُقصد بالمعلومات والمنشورات أن تكون، أو تشكل، أي نصيحة مالية أو استثمارية أو تجارية أو أنواع أخرى من النصائح أو التوصيات المقدمة أو المعتمدة من TradingView. اقرأ المزيد في شروط الاستخدام.