OPEN-SOURCE SCRIPT
تم تحديثه TFEX_INDICATOR_SET13
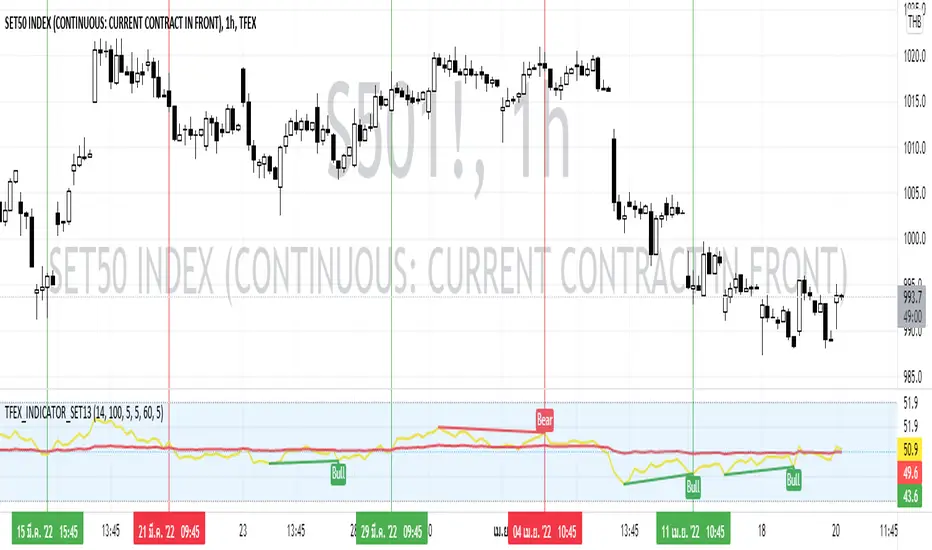
This Indicator use the calculated RSI of the top 13 stocks that have the highest market capitalization in  SET50 where suitable for TFEX trading(
 S501!).
Conducted with 2 RSI period as follow:
How to use:
1) Use this Indicator by Crossover
2) Use this Indicator by Divergence of RSI Main
3) The combination of Divergence and Crossover
Preferred Timeframe
Conducted with 2 RSI period as follow:
- RSI Main (14)
- RSI Average (100)
How to use:
1) Use this Indicator by Crossover
- If the RSI Main Cross UP the RSI Average can assume as BUY SIGNAL
- If the RSI Main Cross DOWN the RSI Average can assume as SELL SIGNAL
2) Use this Indicator by Divergence of RSI Main
- If the RSI Main got any Regular Bullish or Hidden Bullish can assume as BUY SIGNAL
- If the RSI Main got any Regular Bearish or Hidden Bearish can assume as SELL SIGNAL
3) The combination of Divergence and Crossover
- If the RSI Main got any Regular Bullish or Hidden Bullish then pending for the RSI Main Cross UP the RSI Average which can assume as BUY SIGNAL
- If the RSI Main got any Regular Bearish or Hidden Bearish then pending for the RSI Main Cross DOWN the RSI Average which can assume as SELL SIGNAL
Preferred Timeframe
- 4H
- 2H
- 1H
ملاحظات الأخبار
Update name of the RSI appearance settingملاحظات الأخبار
Add Alert Conditionsملاحظات الأخبار
Change Calculation from SCB to EA as SCB delisted in SETملاحظات الأخبار
Update Alert condition to have Overbought and OversoldEdit last description: Change Calculation from SCB to CPN as SCB delisted in SET
ملاحظات الأخبار
Update Chartملاحظات الأخبار
Update NEW SET13 List- AOT
- PTT
- DELTA
- PTTEP
- BCP
- CPALL
- KBANK
- DTAC
- BBL
- BDMS
- ESSO
- KTB
- GULF
ملاحظات الأخبار
Update new stock listنص برمجي مفتوح المصدر
بروح TradingView الحقيقية، قام مبتكر هذا النص البرمجي بجعله مفتوح المصدر، بحيث يمكن للمتداولين مراجعة وظائفه والتحقق منها. شكرا للمؤلف! بينما يمكنك استخدامه مجانًا، تذكر أن إعادة نشر الكود يخضع لقواعد الموقع الخاصة بنا.
إخلاء المسؤولية
لا يُقصد بالمعلومات والمنشورات أن تكون، أو تشكل، أي نصيحة مالية أو استثمارية أو تجارية أو أنواع أخرى من النصائح أو التوصيات المقدمة أو المعتمدة من TradingView. اقرأ المزيد في شروط الاستخدام.
نص برمجي مفتوح المصدر
بروح TradingView الحقيقية، قام مبتكر هذا النص البرمجي بجعله مفتوح المصدر، بحيث يمكن للمتداولين مراجعة وظائفه والتحقق منها. شكرا للمؤلف! بينما يمكنك استخدامه مجانًا، تذكر أن إعادة نشر الكود يخضع لقواعد الموقع الخاصة بنا.
إخلاء المسؤولية
لا يُقصد بالمعلومات والمنشورات أن تكون، أو تشكل، أي نصيحة مالية أو استثمارية أو تجارية أو أنواع أخرى من النصائح أو التوصيات المقدمة أو المعتمدة من TradingView. اقرأ المزيد في شروط الاستخدام.