OPEN-SOURCE SCRIPT
ATR SL and TP with Candle Freeze & DataWindow
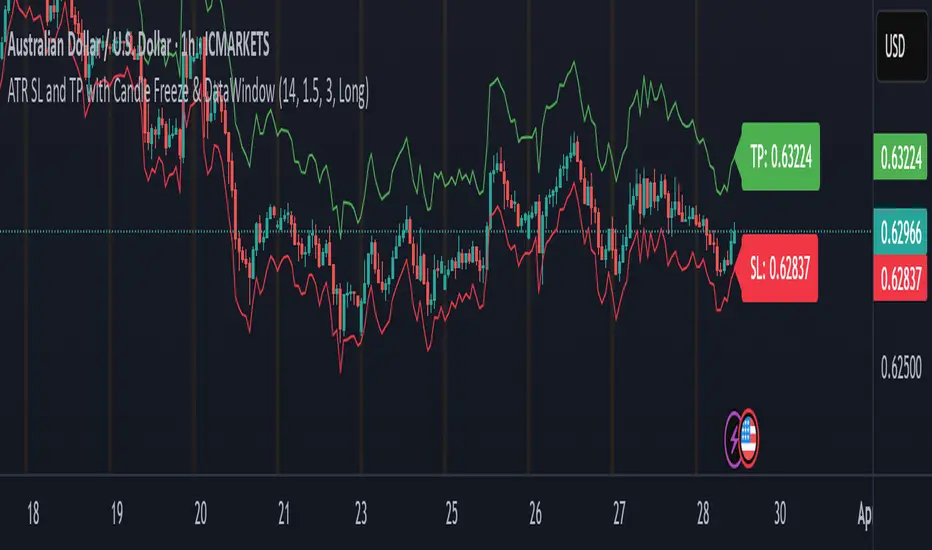
This indicator uses the Average True Range (ATR) to automatically calculate your stop loss (SL) and take profit (TP) levels based on the current market volatility and your chosen multipliers. Here's how it works:
ATR Calculation:
The indicator computes the ATR, which measures the average market volatility over a set period. This value helps gauge how much the price typically moves.
SL and TP Determination:
Depending on whether you're in a long or short trade, the SL and TP are calculated relative to the current price:
For a long trade, the stop loss is set below the current price (by subtracting a multiple of the ATR) and the take profit is set above it (by adding a multiple of the ATR).
For a short trade, the calculations are reversed.
Candle Freeze Feature:
Once a new candle starts, the calculated SL and TP values are "frozen" for that candle. This means they remain constant during the candle's formation, preventing them from updating continuously as the price fluctuates. This can make it easier to plan your trades without the levels shifting mid-candle.
Data Window & Labels:
The SL and TP values are plotted on the chart as lines and displayed in labels for quick reference. Additionally, they appear in TradingView's Data Window, so you can easily copy the price numbers if needed.
Overall, the indicator is designed to help you manage your trades by setting dynamic, volatility-adjusted SL and TP levels that only update at the start of each new candle, aligning with your chosen timeframe. Let me know if you have any more questions or need further adjustments!
نص برمجي مفتوح المصدر
بروح TradingView الحقيقية، قام مبتكر هذا النص البرمجي بجعله مفتوح المصدر، بحيث يمكن للمتداولين مراجعة وظائفه والتحقق منها. شكرا للمؤلف! بينما يمكنك استخدامه مجانًا، تذكر أن إعادة نشر الكود يخضع لقواعد الموقع الخاصة بنا.
إخلاء المسؤولية
لا يُقصد بالمعلومات والمنشورات أن تكون، أو تشكل، أي نصيحة مالية أو استثمارية أو تجارية أو أنواع أخرى من النصائح أو التوصيات المقدمة أو المعتمدة من TradingView. اقرأ المزيد في شروط الاستخدام.