PROTECTED SOURCE SCRIPT
RSI with Dynamic Overbought/Oversold Levels [SwissAlgo]
RSI with Dynamic Overbought/Oversold Levels
RSI indicator with adaptive overbought/oversold levels based on percentile analysis instead of fixed thresholds 30/70.
----------------------------------------------------------------
OVERVIEW
Traditional RSI uses static 30/70 levels that may fail to adapt to changing market conditions. This indicator calculates dynamic overbought/oversold zones based on recent price behavior, providing context-aware signals across dynamic volatility regimes.
----------------------------------------------------------------
KEY FEATURES
----------------------------------------------------------------
HOW IT WORKS
The indicator tracks RSI values over a rolling window and calculates percentile ranks. When RSI reaches its 98th percentile, it means current momentum is stronger than 98% of recent readings — signaling a potentially extreme overbought condition relative to recent behavior, not just an arbitrary fixed level.
----------------------------------------------------------------
USAGE
----------------------------------------------------------------
SETTINGS
----------------------------------------------------------------
ALERTS
Two alert conditions are available:
----------------------------------------------------------------
NOTES
Percentile levels recalculate as new data arrives, providing adaptive context rather than fixed historical values. This is intentional; the indicator shows where RSI stands relative to recent market behavior, not potentially outdated static thresholds.
----------------------------------------------------------------
LIMITATIONS & DISCLAIMER
PERCENTILE RECALCULATION
This indicator uses rolling percentile calculations that update as new price data arrives. Historical percentile levels may shift slightly as the lookback window moves forward. This is by design; the indicator provides context relative to recent market behavior, not static historical thresholds. Users should be aware that backtest results may differ slightly from real-time performance due to this adaptive nature.
NO PREDICTIVE CLAIMS
This indicator identifies when RSI reaches extreme levels relative to recent history. It does NOT predict future price movements, guarantee reversals, or provide trading signals. Extreme overbought/oversold conditions can persist during strong trends, price may continue moving in the same direction even after entering extreme zones.
ALERT TIMING
Alerts trigger when RSI crosses percentile thresholds on bar close. In fast-moving markets, significant price movement may occur between alert generation and user response. Always confirm conditions and DYOR before taking action.
NOT FINANCIAL ADVICE
This tool is for informational and educational purposes only. It does not constitute financial, investment, or trading advice. Past performance of any trading system or methodology is not indicative of future results. Trading involves substantial risk of loss and is not suitable for all investors.
USER RESPONSIBILITY
Users are solely responsible for their trading decisions. Always conduct your own analysis, implement proper risk management, and never risk more than you can afford to lose. Test thoroughly on paper/demo accounts before live trading.
NO WARRANTIES
This indicator is provided "as is" without warranties of any kind. The author assumes no responsibility for trading losses, technical errors, or any damages resulting from the use of this indicator.
RSI indicator with adaptive overbought/oversold levels based on percentile analysis instead of fixed thresholds 30/70.
----------------------------------------------------------------
OVERVIEW
Traditional RSI uses static 30/70 levels that may fail to adapt to changing market conditions. This indicator calculates dynamic overbought/oversold zones based on recent price behavior, providing context-aware signals across dynamic volatility regimes.
----------------------------------------------------------------
KEY FEATURES
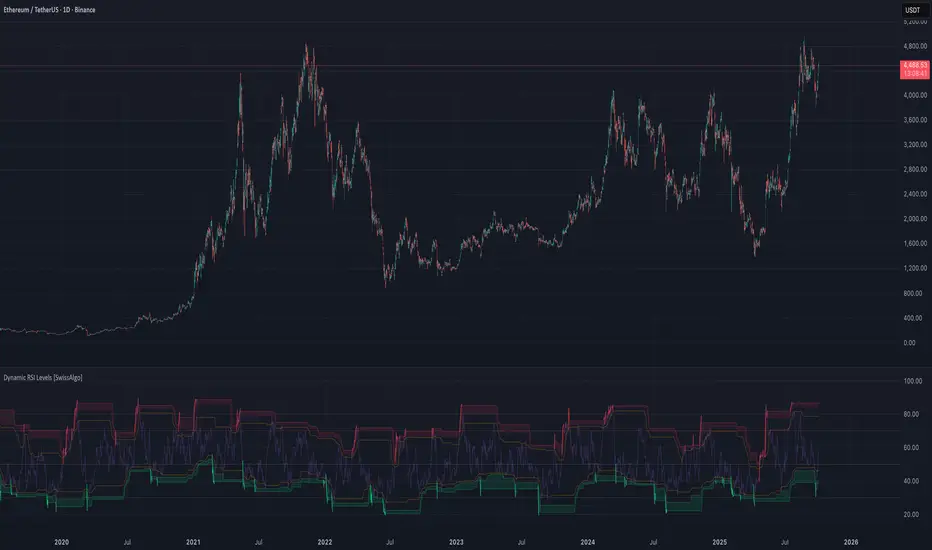
- Dynamic percentile bands (98th, 95th, 90th, 10th, 5th, 2nd) that automatically adjust to current market volatility
- Color-coded RSI line: red when above 98th percentile (extreme overbought), green when below 2nd percentile (extreme oversold), purple otherwise
- Highlighted extreme zones with subtle background fills for easy visual identification
- Adjustable responsiveness: Fast (50 bars), Medium (100 bars), or Slow (200 bars) for different trading styles and timeframes
- Optional smoothing MA with multiple types: SMA, EMA, RMA, WMA, VWMA
- Built-in alerts for extreme overbought/oversold conditions
----------------------------------------------------------------
HOW IT WORKS
The indicator tracks RSI values over a rolling window and calculates percentile ranks. When RSI reaches its 98th percentile, it means current momentum is stronger than 98% of recent readings — signaling a potentially extreme overbought condition relative to recent behavior, not just an arbitrary fixed level.
----------------------------------------------------------------
USAGE
- Watch for RSI entering colored extreme zones (red/green fills) for potential exhaustion signals
- Use the 90th/10th percentile bands as early warning levels
- Combine with price action, support/resistance, or other indicators and your own analysis for confirmation
- Adjust responsiveness based on your timeframe
----------------------------------------------------------------
SETTINGS
- RSI Length: Standard 14-period default, adjustable
- RSI Source: Close price default, customizable
- Responsiveness: Choose how quickly percentile bands adapt to new data
- Smoothing: Optional moving average overlay on RSI
- Show Percentile Bands: Toggle visibility of dynamic levels
----------------------------------------------------------------
ALERTS
Two alert conditions are available:
- RSI Extreme Overbought (crosses above 98th percentile)
- RSI Extreme Oversold (crosses below 2nd percentile)
----------------------------------------------------------------
NOTES
Percentile levels recalculate as new data arrives, providing adaptive context rather than fixed historical values. This is intentional; the indicator shows where RSI stands relative to recent market behavior, not potentially outdated static thresholds.
----------------------------------------------------------------
LIMITATIONS & DISCLAIMER
PERCENTILE RECALCULATION
This indicator uses rolling percentile calculations that update as new price data arrives. Historical percentile levels may shift slightly as the lookback window moves forward. This is by design; the indicator provides context relative to recent market behavior, not static historical thresholds. Users should be aware that backtest results may differ slightly from real-time performance due to this adaptive nature.
NO PREDICTIVE CLAIMS
This indicator identifies when RSI reaches extreme levels relative to recent history. It does NOT predict future price movements, guarantee reversals, or provide trading signals. Extreme overbought/oversold conditions can persist during strong trends, price may continue moving in the same direction even after entering extreme zones.
ALERT TIMING
Alerts trigger when RSI crosses percentile thresholds on bar close. In fast-moving markets, significant price movement may occur between alert generation and user response. Always confirm conditions and DYOR before taking action.
NOT FINANCIAL ADVICE
This tool is for informational and educational purposes only. It does not constitute financial, investment, or trading advice. Past performance of any trading system or methodology is not indicative of future results. Trading involves substantial risk of loss and is not suitable for all investors.
USER RESPONSIBILITY
Users are solely responsible for their trading decisions. Always conduct your own analysis, implement proper risk management, and never risk more than you can afford to lose. Test thoroughly on paper/demo accounts before live trading.
NO WARRANTIES
This indicator is provided "as is" without warranties of any kind. The author assumes no responsibility for trading losses, technical errors, or any damages resulting from the use of this indicator.
نص برمجي محمي
تم نشر هذا النص البرمجي كمصدر مغلق. ومع ذلك، يمكنك استخدامه بحرية ودون أي قيود - تعرف على المزيد هنا.
إخلاء المسؤولية
لا يُقصد بالمعلومات والمنشورات أن تكون، أو تشكل، أي نصيحة مالية أو استثمارية أو تجارية أو أنواع أخرى من النصائح أو التوصيات المقدمة أو المعتمدة من TradingView. اقرأ المزيد في شروط الاستخدام.