OPEN-SOURCE SCRIPT
Bull Market Support Band (20W SMA + 21W EMA)
🟩 Bull Market Support Band (20W SMA + 21W EMA) [v6]
OVERVIEW
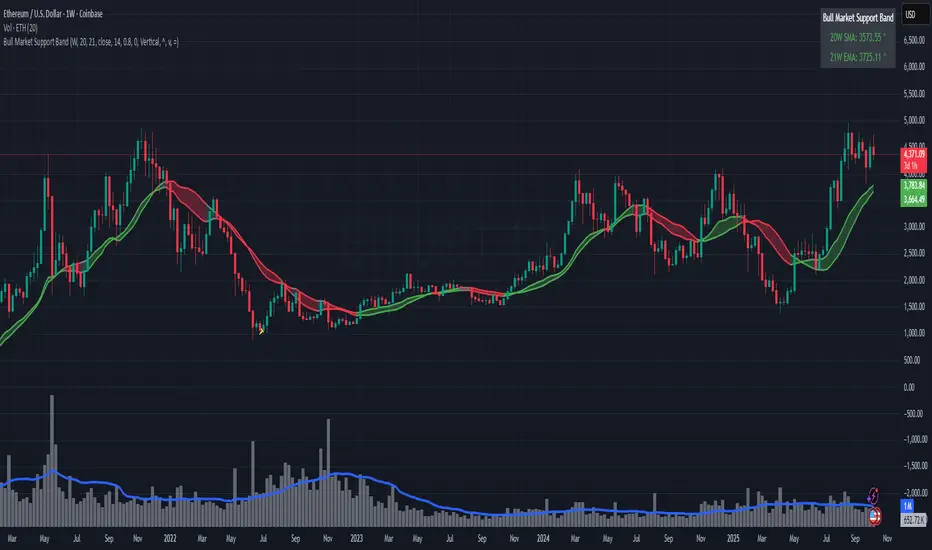
The Bull Market Support Band is a long-term trend indicator that combines the 20-week SMA and 21-week EMA.
When price is above the band → bullish trend.
When below → bearish trend.
When within → neutral or transition phase.
This v6 version adds full customization, dynamic coloring, event labels, candle coloring, and a configurable on-chart legend table with trend arrows.
HOW IT WORKS
INCLUDED FEATURES
USAGE TIPS
INTERPRETATION GUIDE
Sustained closes above or below the band typically align with major market cycle shifts.
NOTES
CREDITS
Original concept: The Bull Market Support Band (popularized in crypto analysis).
Enhanced Pine Script v6 version: Ricco.
Modernized for clarity, flexibility, and multi-timeframe accuracy.
SUMMARY
A modern, customizable Bull Market Support Band indicator highlighting long-term market regimes with clean visuals, color logic, and convenience features.
Designed for traders seeking macro clarity, minimal clutter, and professional presentation.
OVERVIEW
The Bull Market Support Band is a long-term trend indicator that combines the 20-week SMA and 21-week EMA.
When price is above the band → bullish trend.
When below → bearish trend.
When within → neutral or transition phase.
This v6 version adds full customization, dynamic coloring, event labels, candle coloring, and a configurable on-chart legend table with trend arrows.
HOW IT WORKS
- Calculates the 20W SMA and 21W EMA from a user-selectable higher timeframe (weekly by default).
- Plots both averages and shades the area between them to form the support band.
- The fill and line colors change automatically based on the market phase:
🟩 Green = Bullish (price above)
🟥 Red = Bearish (price below)
⬜ Gray = Neutral (price within). - Labels appear only when the trend state changes.
- Alerts trigger when price crosses the band or either moving average.
- Optional candle coloring applies the same bull/bear/neutral logic to price bars.
- A convenience legend table displays current 20W SMA and 21W EMA values, along with slope arrows (^, v, =).
INCLUDED FEATURES
- Configurable calculation timeframe.
- Automatic band fill and line coloring.
- Optional candle coloring overlay.
- Compact or detailed regime-change labels.
- ATR-based label offset and spacing control.
- Customizable legend table with background color.
- Horizontal or vertical legend layout.
- Custom arrow characters (ASCII or Unicode).
- Built-in alerts for band and MA crosses.
- Optimized for higher-timeframe accuracy using request.security().
USAGE TIPS
- Keep the default weekly setting for macro trend context.
- On lower chart timeframes, use the band as higher-level support/resistance.
- Combine with momentum or volume indicators (RSI, MACD, OBV) for confirmation.
- Adjust ATR multiplier to move labels further from price candles.
- Increase “Min bars between labels” to reduce visual clutter.
- Disable auto-coloring if you prefer a static color theme.
- Toggle compact legend or switch between horizontal/vertical layouts for best fit.
INTERPRETATION GUIDE
- 🟩 Bullish: Price above the band → trend continuation likely.
- ⬜ Neutral: Price within the band → consolidation or potential reversal zone.
- 🟥 Bearish: Price below the band → downtrend continuation or distribution.
Sustained closes above or below the band typically align with major market cycle shifts.
NOTES
- Uses request.security() for higher-timeframe precision — accurate even on smaller charts.
- The legend table is screen-anchored and remains fixed as you pan or zoom.
- Plots and labels are price-anchored and move with candles.
- Lightweight and efficient for all markets and intervals.
CREDITS
Original concept: The Bull Market Support Band (popularized in crypto analysis).
Enhanced Pine Script v6 version: Ricco.
Modernized for clarity, flexibility, and multi-timeframe accuracy.
SUMMARY
A modern, customizable Bull Market Support Band indicator highlighting long-term market regimes with clean visuals, color logic, and convenience features.
Designed for traders seeking macro clarity, minimal clutter, and professional presentation.
نص برمجي مفتوح المصدر
بروح TradingView الحقيقية، قام مبتكر هذا النص البرمجي بجعله مفتوح المصدر، بحيث يمكن للمتداولين مراجعة وظائفه والتحقق منها. شكرا للمؤلف! بينما يمكنك استخدامه مجانًا، تذكر أن إعادة نشر الكود يخضع لقواعد الموقع الخاصة بنا.
إخلاء المسؤولية
لا يُقصد بالمعلومات والمنشورات أن تكون، أو تشكل، أي نصيحة مالية أو استثمارية أو تجارية أو أنواع أخرى من النصائح أو التوصيات المقدمة أو المعتمدة من TradingView. اقرأ المزيد في شروط الاستخدام.