OPEN-SOURCE SCRIPT
تم تحديثه Volume Distribution (Heat Map)
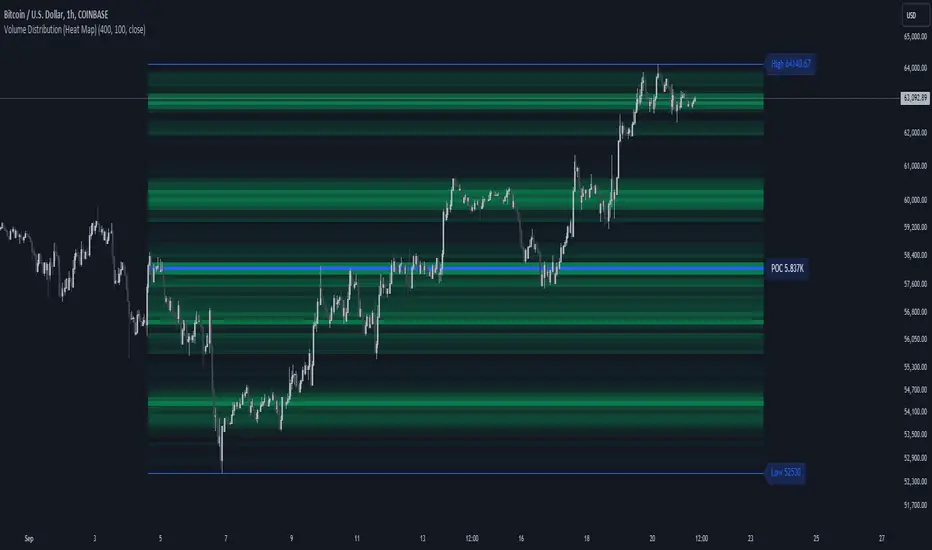
This Pine Script indicator, "Volume Distribution (Heat Map)" is designed to visualize the distribution of volume across different price levels over a specified lookback period. Here's a detailed breakdown of its functionality and features:
Indicator Overview
User Inputs
Logic
The script iterates through the number of bins, calculates the volume for each bin between highest and lowest prices for length period, and updates the corresponding bin in the freq array if the current bar is allowed.
If the current bar is the last bar, the script plots lines and labels based on the volume distribution.
Heatmap Lines:
Solid lines colored based on the volume in each bin, using a gradient from no color to the main color based on amount of volume.

Highest Volume Line:
A dashed red line indicating the bin with the highest volume.

Labels:
Labels for the highest and lowest prices and the volume at the highest volume bin.

Plots
Highest Price Plot: Plots the highest price within the lookback period if the current bar is within the allowed range.
Lowest Price Plot: Plots the lowest price within the lookback period if the current bar is within the allowed range.

Summary
This indicator provides a visual representation of where trading volume is concentrated across different price levels, forming a heatmap. The highest volume level is highlighted with a dashed red line and a label indicating the volume at that level. This can help traders identify significant price levels where trading activity is clustered.
The "Volume Distribution (Heat Map)" indicator is a valuable tool for traders looking to enhance their technical analysis by incorporating volume data into their price charts. It provides a clear and visual representation of where market participants are most active, aiding in better-informed trading decisions.
Indicator Overview
User Inputs
- Length: The lookback period for analysis, defaulting to 500 bars.
- Source: The price source used for calculations (default is the close price).
- Color Intensity: Adjusts the intensity of the heatmap colors, with a default value of 25.
- Lines Width: The width of the plotted lines, with a default value of 10.
- Main Color: The main color used for the heatmap (default is lime).
Logic
The script iterates through the number of bins, calculates the volume for each bin between highest and lowest prices for length period, and updates the corresponding bin in the freq array if the current bar is allowed.
If the current bar is the last bar, the script plots lines and labels based on the volume distribution.
Heatmap Lines:
Solid lines colored based on the volume in each bin, using a gradient from no color to the main color based on amount of volume.
Highest Volume Line:
A dashed red line indicating the bin with the highest volume.
Labels:
Labels for the highest and lowest prices and the volume at the highest volume bin.
Plots
Highest Price Plot: Plots the highest price within the lookback period if the current bar is within the allowed range.
Lowest Price Plot: Plots the lowest price within the lookback period if the current bar is within the allowed range.
Summary
This indicator provides a visual representation of where trading volume is concentrated across different price levels, forming a heatmap. The highest volume level is highlighted with a dashed red line and a label indicating the volume at that level. This can help traders identify significant price levels where trading activity is clustered.
The "Volume Distribution (Heat Map)" indicator is a valuable tool for traders looking to enhance their technical analysis by incorporating volume data into their price charts. It provides a clear and visual representation of where market participants are most active, aiding in better-informed trading decisions.
ملاحظات الأخبار
Fixed Volume Calculationملاحظات الأخبار
Added Number Of Bins to the User Inputsملاحظات الأخبار
Updated Volume Calculated Logicملاحظات الأخبار
- Remastered Logic and Visual of indicator.- Added High and Low Levels
نص برمجي مفتوح المصدر
بروح TradingView الحقيقية، قام مبتكر هذا النص البرمجي بجعله مفتوح المصدر، بحيث يمكن للمتداولين مراجعة وظائفه والتحقق منها. شكرا للمؤلف! بينما يمكنك استخدامه مجانًا، تذكر أن إعادة نشر الكود يخضع لقواعد الموقع الخاصة بنا.
إخلاء المسؤولية
لا يُقصد بالمعلومات والمنشورات أن تكون، أو تشكل، أي نصيحة مالية أو استثمارية أو تجارية أو أنواع أخرى من النصائح أو التوصيات المقدمة أو المعتمدة من TradingView. اقرأ المزيد في شروط الاستخدام.