Trading Loons Algo - V1
Greetings! Thank you for your interest in our script. We are very pleased with the accuracy of our indicators and are highly confident they will augment your trading strategy.
These indicators are designed to identify momentum for low-float stocks under $20 and signal optimal ‘bullish’ entry and ‘bearish’ exit.
Our indicators span across whichever time interval candle best suits your trading strategy and are intended to be used for both intraday traders (e.g. leveraging 1m, 3m, 5m, etc. candles) as well as multiday traders (leveraging daily candles).
For intraday trading best results, we recommend leveraging 1m candles for high-volume & low-float moving stocks. However, they will work on any stock under evaluation.
For multiday trading best results, we recommend leveraging the daily candles for stocks under $20 and looking for the green uptrend arrow indicating ‘bullish’ momentum. A red downtrend arrow indicates ‘bearish’ momentum.
This script offers a variety of indicators and we will continue to enhance its offerings.
We recommend the following indicator configuration:
Intraday Trading:
- Display Intraday Bullish Momentum Alert
- Display Intraday Volume Crossover
- Display Intraday Full Session High and Low
- Display Volume Weighted Average Price (VWAP)
Multiday Trading:
- Display Daily Regular Session High and Low
- Daily Regular Session High and Low Max Range Value (200)
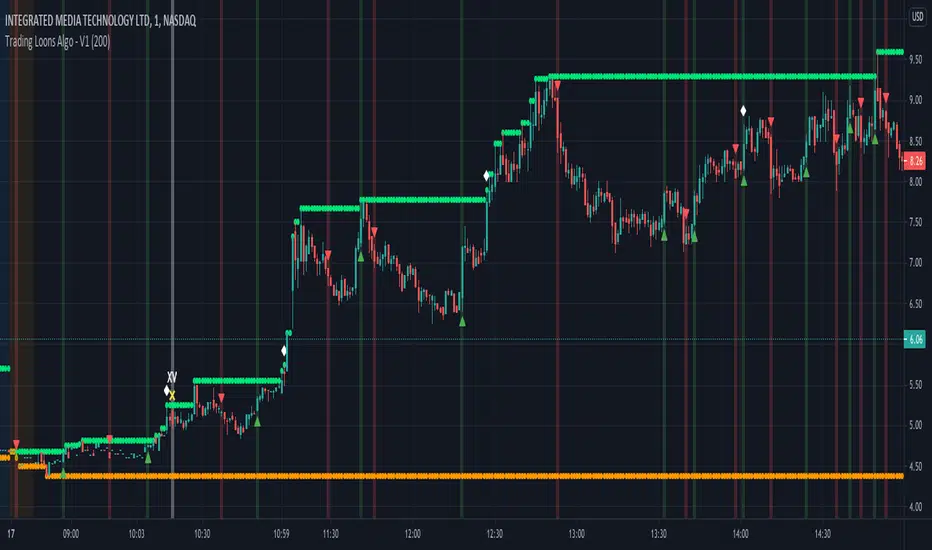
How to use it for intraday trading:
- Find a low-float stock, preferably under 20 million, that is already up 15%.
- Load the 1-minute (1m) chart and look for the ‘Display Intraday Bullish Momentum Alert’ indicator which is a white diamond above the bar when the bar closes.
Trading Loons Tip: It’s not necessary, but if you see the ‘XV’ indicator (i.e. from the ‘Display Intraday Volume Crossover’ indicator), you know there is above average volume coming in, which is a bullish sign!
- If the bar with the ‘Display Intraday Bullish Momentum Alert’ indicator reached a new high of the day, wait for a pull-back and allow for the accumulation period. The accumulation period could last a few minutes or tens-of-minutes.
- During the accumulation period, look for a green ‘bullish’ uptrend indicator arrow below the 1-minute bar once the bar closes.
NOTE: We recommend using the 1-minute bar. However, these intraday indicators can be used on whichever bar chart aligns with your trading strategy (e.g. 3m, 5m, etc.)
Please reference these intraday chart examples:
How to use it for multiday trading:
- Find a stock under $20 dollars (the lower the float, the better).
- Load the daily (D) chart and look for a green ‘bullish’ uptrend indicator arrow below the bar once the daily bar closes.
Please reference these multiday chart examples:
You can set up your own alerts to be notified when there is ‘bullish’ multiday momentum (green uptrend triangle below bar), ‘bearish’ multiday momentum (red downtrend triangle above bar) or ‘bullish’ intraday momentum (white diamond above bar).
Please note, you will need to subscribe to market data on TradingView. We suggest subscribing to the following:
- ARCA – ARCA & MKT
- NASDAQ – NASDAQ Stock Market
- NYSE – New York Stock Exchange
Disclaimer: If you are using this script, you acknowledge past performance is not necessarily indicative of future results and no script can 100% guarantee success in trading.
نص برمجي للمستخدمين المدعوين فقط
يمكن فقط للمستخدمين الذين تمت الموافقة عليهم من قبل المؤلف الوصول إلى هذا البرنامج النصي. ستحتاج إلى طلب الإذن والحصول عليه لاستخدامه. يتم منح هذا عادةً بعد الدفع. لمزيد من التفاصيل، اتبع تعليمات المؤلف أدناه أو اتصل ب TradingLoons مباشرة.
لا توصي TradingView بالدفع مقابل برنامج نصي أو استخدامه إلا إذا كنت تثق تمامًا في مؤلفه وتفهم كيفية عمله. يمكنك أيضًا العثور على بدائل مجانية ومفتوحة المصدر في نصوص مجتمعنا.
تعليمات المؤلف
Learn more about the products we offer at: tradingloons.com
Follow us on Twitter: @tradingloons
إخلاء المسؤولية
نص برمجي للمستخدمين المدعوين فقط
يمكن فقط للمستخدمين الذين تمت الموافقة عليهم من قبل المؤلف الوصول إلى هذا البرنامج النصي. ستحتاج إلى طلب الإذن والحصول عليه لاستخدامه. يتم منح هذا عادةً بعد الدفع. لمزيد من التفاصيل، اتبع تعليمات المؤلف أدناه أو اتصل ب TradingLoons مباشرة.
لا توصي TradingView بالدفع مقابل برنامج نصي أو استخدامه إلا إذا كنت تثق تمامًا في مؤلفه وتفهم كيفية عمله. يمكنك أيضًا العثور على بدائل مجانية ومفتوحة المصدر في نصوص مجتمعنا.
تعليمات المؤلف
Learn more about the products we offer at: tradingloons.com
Follow us on Twitter: @tradingloons