PINE LIBRARY
تم تحديثه SessionVolumeProfile
Library "SessionVolumeProfile"
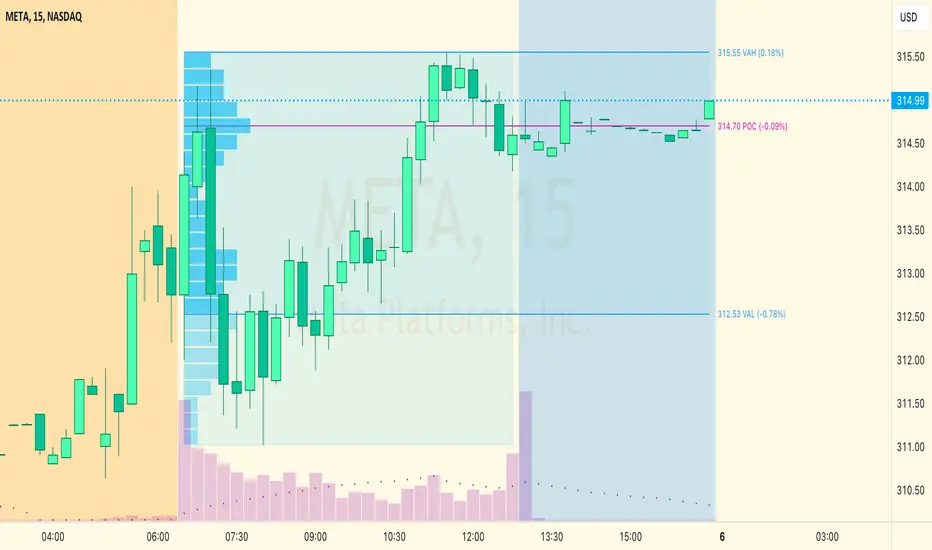
Analyzes price & volume during regular trading hours to provide a session volume profile analysis. The primary goal of this library is to provide the developer with three values: the value area high, low and the point of control. The library also provides methods for rendering the value areas and histograms. To learn more about this library and how you can use it, click on the website link in my profile where you will find a blog post with detailed information.
debug(vp, position)
Helper function to write some information about the supplied SVP object to the screen in a table.
Parameters:
vp (Object): The SVP object to debug
position (string): The position.* to place the table. Defaults to position.bottom_center
getLowerTimeframe()
Depending on the timeframe of the chart, determines a lower timeframe to grab volume data from for the analysis
Returns: The timeframe string to fetch volume for
get(volumeProfile, lowerTimeframeHigh, lowerTimeframeLow, lowerTimeframeVolume)
Populated the provided SessionVolumeProfile object with vp data on the session.
Parameters:
volumeProfile (Object): The SessionVolumeProfile object to populate
lowerTimeframeHigh (float[]): The lower timeframe high values
lowerTimeframeLow (float[]): The lower timeframe low values
lowerTimeframeVolume (float[]): The lower timeframe volume values
drawPriorValueAreas(todaySessionVolumeProfile, extendYesterdayOverToday, showLabels, labelSize, pocColor, pocStyle, pocWidth, vahlColor, vahlStyle, vahlWidth, vaColor)
Given a SessionVolumeProfile Object, will render the historical value areas for that object.
Parameters:
todaySessionVolumeProfile (Object): The SessionVolumeProfile Object to draw
extendYesterdayOverToday (bool): Defaults to true
showLabels (bool): Defaults to true
labelSize (string): Defaults to size.small
pocColor (color): Defaults to #e500a4
pocStyle (string): Defaults to line.style_solid
pocWidth (int): Defaults to 1
vahlColor (color): The color of the value area high/low lines. Defaults to #1592e6
vahlStyle (string): The style of the value area high/low lines. Defaults to line.style_solid
vahlWidth (int): The width of the value area high/low lines. Defaults to 1
vaColor (color): The color of the value area background. Defaults to #00bbf911)
drawHistogram(volumeProfile, bgColor, showVolumeOnHistogram)
Given a SessionVolumeProfile object, will render the histogram for that object.
Parameters:
volumeProfile (Object): The SessionVolumeProfile object to draw
bgColor (color): The baseline color to use for the histogram. Defaults to #00bbf9
showVolumeOnHistogram (bool): Show the volume amount on the histogram bars. Defaults to false.
Object
Fields:
numberOfRows (series__integer)
valueAreaCoverage (series__integer)
trackDevelopingVa (series__bool)
valueAreaHigh (series__float)
pointOfControl (series__float)
valueAreaLow (series__float)
startTime (series__integer)
endTime (series__integer)
dayHigh (series__float)
dayLow (series__float)
step (series__float)
pointOfControlLevel (series__integer)
valueAreaHighLevel (series__integer)
valueAreaLowLevel (series__integer)
volumeRows (array__float)
priceLevelRows (array__float)
ltfSessionHighs (array__float)
ltfSessionLows (array__float)
ltfSessionVols (array__float)
ملاحظات الأخبار
v2 Removed incorrect comments.ملاحظات الأخبار
v3 Updated library to use the lower timeframe bars to determine the session. This makes the code work for futures.Updated:
get(volumeProfile, lowerTimeframeHigh, lowerTimeframeLow, lowerTimeframeVolume, lowerTimeframeTime, lowerTimeframeSessionIsMarket)
Populated the provided SessionVolumeProfile object with vp data on the session.
Parameters:
volumeProfile (Object): The SessionVolumeProfile object to populate
lowerTimeframeHigh (array<float>): The lower timeframe high values
lowerTimeframeLow (array<float>): The lower timeframe low values
lowerTimeframeVolume (array<float>): The lower timeframe volume values
lowerTimeframeTime (array<int>): The lower timeframe time values
lowerTimeframeSessionIsMarket (array<bool>): The lower timeframe session.ismarket values (that are futures-friendly)
ملاحظات الأخبار
v4 Fixed a bug that wiped out the first bars on the sessionملاحظات الأخبار
v5 Small optimization moving away from arrays to maps.Updated:
Object
Fields:
numberOfRows (series int)
valueAreaCoverage (series int)
trackDevelopingVa (series bool)
valueAreaHigh (series float)
pointOfControl (series float)
valueAreaLow (series float)
startTime (series int)
endTime (series int)
dayHigh (series float)
dayLow (series float)
step (series float)
pointOfControlLevel (series int)
valueAreaHighLevel (series int)
valueAreaLowLevel (series int)
volumeRows (map<int, float>)
ltfSessionHighs (array<float>)
ltfSessionLows (array<float>)
ltfSessionVols (array<float>)
ملاحظات الأخبار
v6 Fixed a bug that caused value areas to compute incorrectly when lower timeframes were missing data (ie. symbols moving on lower volume, missing candles)ملاحظات الأخبار
v7 Fixed a bug where the hourly charts were missing data between market open and the first round hour. ملاحظات الأخبار
v8 Previous release introduced a bug where the library failed to return values with extended hours turned off on the chart. This release fixes that bug.ملاحظات الأخبار
v9 Updated library to use updated Session library, which includes a fix for TradingView's bug where session.ismarket returns true when in replay mode in non-market hours.ملاحظات الأخبار
v10 Removed debugging codeملاحظات الأخبار
v11 Fixed bugs related to crypto sessions in an underlying library.ملاحظات الأخبار
v12 Upgraded library to get the latest fixes in the underlying Session libraryمكتبة باين
كمثال للقيم التي تتبناها TradingView، نشر المؤلف شيفرة باين كمكتبة مفتوحة المصدر بحيث يمكن لمبرمجي باين الآخرين من مجتمعنا استخدامه بحرية. تحياتنا للمؤلف! يمكنك استخدام هذه المكتبة بشكل خاص أو في منشورات أخرى مفتوحة المصدر، ولكن إعادة استخدام هذا الرمز في المنشورات تخضع لقواعد الموقع.
I release TradingView indicators and libraries designed to make you a better trader. For detailed info about them, head over to improve.trading
إخلاء المسؤولية
لا يُقصد بالمعلومات والمنشورات أن تكون، أو تشكل، أي نصيحة مالية أو استثمارية أو تجارية أو أنواع أخرى من النصائح أو التوصيات المقدمة أو المعتمدة من TradingView. اقرأ المزيد في شروط الاستخدام.
مكتبة باين
كمثال للقيم التي تتبناها TradingView، نشر المؤلف شيفرة باين كمكتبة مفتوحة المصدر بحيث يمكن لمبرمجي باين الآخرين من مجتمعنا استخدامه بحرية. تحياتنا للمؤلف! يمكنك استخدام هذه المكتبة بشكل خاص أو في منشورات أخرى مفتوحة المصدر، ولكن إعادة استخدام هذا الرمز في المنشورات تخضع لقواعد الموقع.
I release TradingView indicators and libraries designed to make you a better trader. For detailed info about them, head over to improve.trading
إخلاء المسؤولية
لا يُقصد بالمعلومات والمنشورات أن تكون، أو تشكل، أي نصيحة مالية أو استثمارية أو تجارية أو أنواع أخرى من النصائح أو التوصيات المقدمة أو المعتمدة من TradingView. اقرأ المزيد في شروط الاستخدام.