OPEN-SOURCE SCRIPT
Different Donchian Periods
Hi!
This is a very simple script that I couldn't find on TradingView yet. Look at this indicator how you want (band, cloud, ma's) and create your own settings, I did not test it.
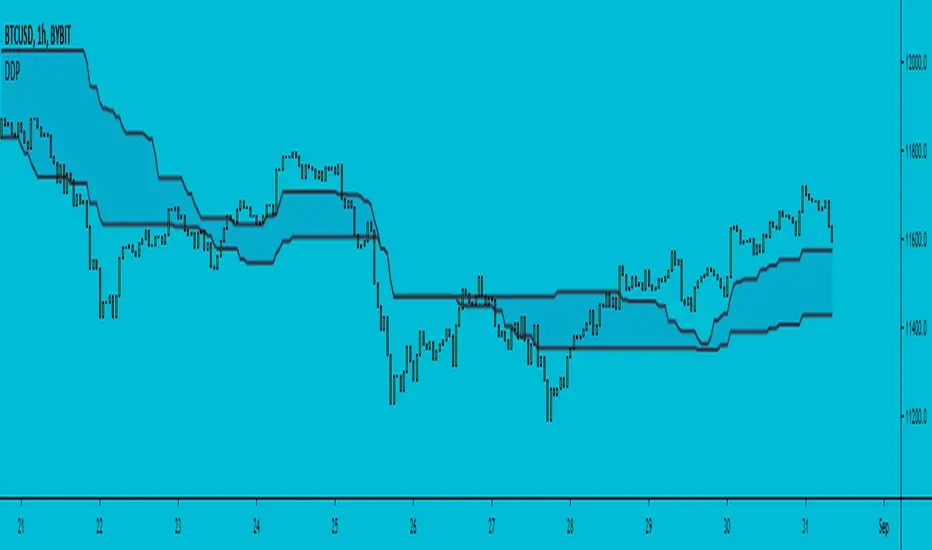
Normally, Donchian average calculates the average(middle) of the highest point of a given period and the lowest point of that same period.
Here I use two separate periods, one for highest, a different one for lowest. That's it :)
Let me know if it's useful to you, I appreciate your comments.
This is a very simple script that I couldn't find on TradingView yet. Look at this indicator how you want (band, cloud, ma's) and create your own settings, I did not test it.
Normally, Donchian average calculates the average(middle) of the highest point of a given period and the lowest point of that same period.
Here I use two separate periods, one for highest, a different one for lowest. That's it :)
Let me know if it's useful to you, I appreciate your comments.
نص برمجي مفتوح المصدر
بروح TradingView الحقيقية، قام مبتكر هذا النص البرمجي بجعله مفتوح المصدر، بحيث يمكن للمتداولين مراجعة وظائفه والتحقق منها. شكرا للمؤلف! بينما يمكنك استخدامه مجانًا، تذكر أن إعادة نشر الكود يخضع لقواعد الموقع الخاصة بنا.
إخلاء المسؤولية
لا يُقصد بالمعلومات والمنشورات أن تكون، أو تشكل، أي نصيحة مالية أو استثمارية أو تجارية أو أنواع أخرى من النصائح أو التوصيات المقدمة أو المعتمدة من TradingView. اقرأ المزيد في شروط الاستخدام.