OPEN-SOURCE SCRIPT
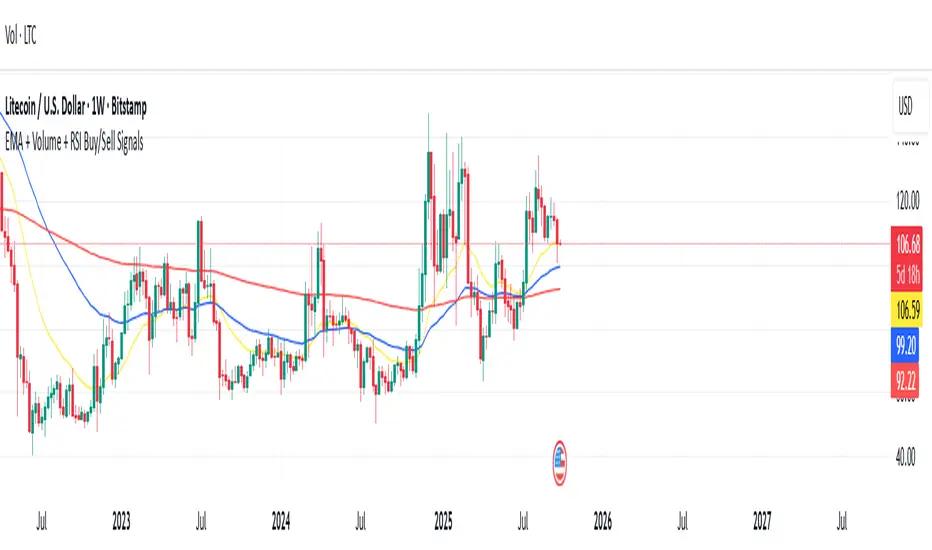
EMA + Volume + RSI Buy/Sell Signals
//version=5
indicator("EMA + Volume + RSI Buy/Sell Signals", overlay=true)
// === Inputs ===
ema20 = ta.ema(close, 20)
ema50 = ta.ema(close, 50)
ema200 = ta.ema(close, 200)
rsi = ta.rsi(close, 14)
// === Conditions ===
// Price % change from yesterday
priceChange = (close - close[1]) / close[1] * 100
// Volume condition
volCondition = volume > 1.5 * volume[1]
// RSI
rsiOverbought = rsi > 70
rsiOversold = rsi < 30
// Price move conditions
priceUp5 = priceChange > 5
priceDown5 = priceChange < -5
// === Buy & Sell Conditions ===
buySignal = close > ema20 and close > ema50 and close > ema200 and priceUp5 and volCondition and rsiOversold
sellSignal = close < ema20 and close < ema50 and close < ema200 and priceDown5 and volCondition and rsiOverbought
// === Plot EMAs ===
plot(ema20, color=color.yellow, title="EMA 20")
plot(ema50, color=color.blue, title="EMA 50")
plot(ema200, color=color.red, title="EMA 200")
// === Plot Signals on Chart ===
plotshape(buySignal, title="BUY Signal", style=shape.labelup, color=color.green, text="BUY", location=location.belowbar, size=size.normal)
plotshape(sellSignal, title="SELL Signal", style=shape.labeldown, color=color.red, text="SELL", location=location.abovebar, size=size.normal)
// === Background Highlight for Visuals ===
bgcolor(buySignal ? color.new(color.green, 85) : na)
bgcolor(sellSignal ? color.new(color.red, 85) : na)
نص برمجي مفتوح المصدر
بروح TradingView الحقيقية، قام مبتكر هذا النص البرمجي بجعله مفتوح المصدر، بحيث يمكن للمتداولين مراجعة وظائفه والتحقق منها. شكرا للمؤلف! بينما يمكنك استخدامه مجانًا، تذكر أن إعادة نشر الكود يخضع لقواعد الموقع الخاصة بنا.
إخلاء المسؤولية
لا يُقصد بالمعلومات والمنشورات أن تكون، أو تشكل، أي نصيحة مالية أو استثمارية أو تجارية أو أنواع أخرى من النصائح أو التوصيات المقدمة أو المعتمدة من TradingView. اقرأ المزيد في شروط الاستخدام.