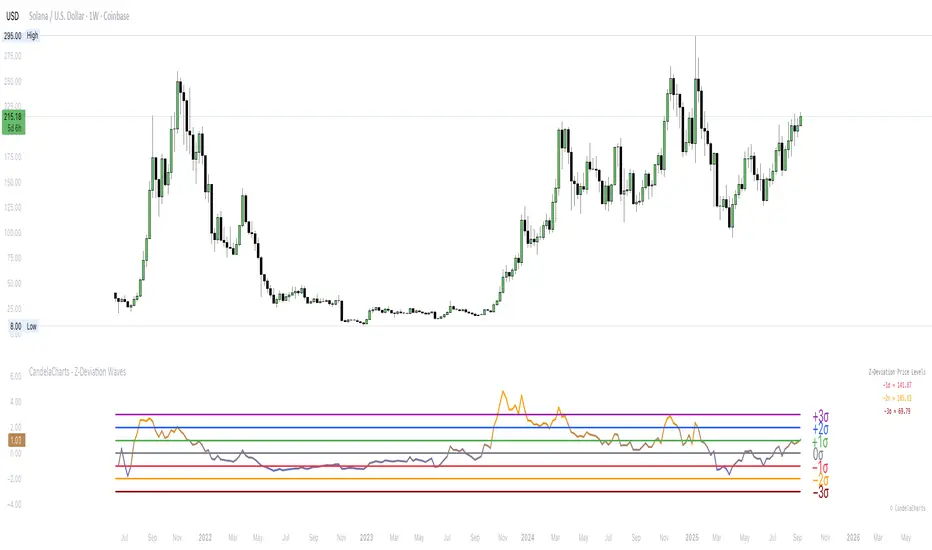
CandelaCharts - Z-Deviation Waves
Volatility feels chaotic until you anchor it to statistics—then “stretch” and “snap-back” become measurable.
The CandelaCharts – Z-Deviation Waves turns your price source into a rolling Z-score (distance from its mean in standard deviations) and visualizes it as a color-graded wave with optional trend columns and labeled sigma lines. You can label pure σ levels, show the price at σ, or use a fixed “Price @ Z” grid for consistent visuals.
📦 Features
Designed to spotlight statistical extremes and make them tradable.
- Rolling Z-score: Mean + stdev over a configurable window, with optional smoothing.
- Three label modes:
Z-score (σ) — classic −3σ…+3σ lines/labels.
Price @ σ — converts each σ level into the live price.
Price @ Z — maps Z to a fixed numeric grid for legacy/visual consistency. - Trend columns: Subtle columns behind the wave to show rising vs. falling Z.
- Gradient wave: Blue→orange scale tied to Z intensity (−3…+3).
- Quick table: Optional on-chart prices for −1σ / −2σ / −3σ.
- Polish: Font family/size controls and branding toggle.
⚙️ Settings
Pick your statistical lens, then choose how to display it.
- Period: Rolling window for mean & stdev.
- Source: Price input (Close by default).
- Text Size: Label size for σ lines.
- Smoothing (Z): SMA on Z to calm noise.
- Label Mode: Z-score (σ) / Price @ σ / Price @ Z.
- Show Trend Columns: Rising/falling backdrop.
- Show −2σ/−3σ Table: Quick downside prices (σ mode).
⚡️ Showcase
Mean-reversion extremes: Tag touches beyond ±2σ and subsequent reversions.
Price @ σ ladder: Show live price equivalents for −1σ/−2σ/−3σ as dynamic supports.
Smoothing on/off: Compare Z with smoothing 1 vs. 5 to demonstrate noise control.
📒 Usage
Treat σ as a “stretch gauge,” then layer your entries with structure and risk rules.
- Read the tiers:
±1σ — routine fluctuation.
±2σ — statistically significant; watch for exhaustion or follow-through.
±3σ — extreme; look for mean-reversion triggers or parabolic blow-off risk. - Price @ σ for levels: Use −1σ/−2σ as dynamic pullback/mean targets; +1σ/+2σ as potential resistance in downtrends.
- Trend columns as timing: Fade extremes only when Z momentum stalls (columns stop rising against you).
- Calibrate window: Shorter Period = faster, noisier signals; longer = steadier, fewer extremes.
- Confluence: Pair with RSI/MACD divergence or key S/R for higher-quality reversions.
🚨 Alerts
There are no built-in alerts; add simple manual ones.
- Crosses of ±1σ / ±2σ / ±3σ (plot value vs. horizontal lines).
- Z turning down after tagging +2σ/+3σ (or turning up after −2σ/−3σ).
- Re-entry into the −1σ…+1σ band after an extreme (cool-down).
⚠️ Disclaimer
These tools are exclusively available on the TradingView platform.
Our charting tools are intended solely for informational and educational purposes and should not be regarded as financial, investment, or trading advice. They are not designed to predict market movements or offer specific recommendations. Users should be aware that past performance is not indicative of future results and should not rely on these tools for financial decisions. By using these charting tools, the purchaser agrees that the seller and creator hold no responsibility for any decisions made based on information provided by the tools. The purchaser assumes full responsibility and liability for any actions taken and their consequences, including potential financial losses or investment outcomes that may result from the use of these products.
By purchasing, the customer acknowledges and accepts that neither the seller nor the creator is liable for any undesired outcomes stemming from the development, sale, or use of these products. Additionally, the purchaser agrees to indemnify the seller from any liability. If invited through the Friends and Family Program, the purchaser understands that any provided discount code applies only to the initial purchase of Candela's subscription. The purchaser is responsible for canceling or requesting cancellation of their subscription if they choose not to continue at the full retail price. In the event the purchaser no longer wishes to use the products, they must unsubscribe from the membership service, if applicable.
We do not offer reimbursements, refunds, or chargebacks. Once these Terms are accepted at the time of purchase, no reimbursements, refunds, or chargebacks will be issued under any circumstances.
By continuing to use these charting tools, the user confirms their understanding and acceptance of these Terms as outlined in this disclaimer.
نص برمجي للمستخدمين المدعوين فقط
Only users approved by the author can access this script. You'll need to request and get permission to use it. This is typically granted after payment. For more details, follow the author's instructions below or contact CandelaCharts directly.
TradingView does NOT recommend paying for or using a script unless you fully trust its author and understand how it works. You may also find free, open-source alternatives in our community scripts.
تعليمات المؤلف
Join our community: discord.gg/etGSTepqbu
All content provided by CandelaCharts is for informational & educational purposes only.
إخلاء المسؤولية
نص برمجي للمستخدمين المدعوين فقط
Only users approved by the author can access this script. You'll need to request and get permission to use it. This is typically granted after payment. For more details, follow the author's instructions below or contact CandelaCharts directly.
TradingView does NOT recommend paying for or using a script unless you fully trust its author and understand how it works. You may also find free, open-source alternatives in our community scripts.
تعليمات المؤلف
Join our community: discord.gg/etGSTepqbu
All content provided by CandelaCharts is for informational & educational purposes only.