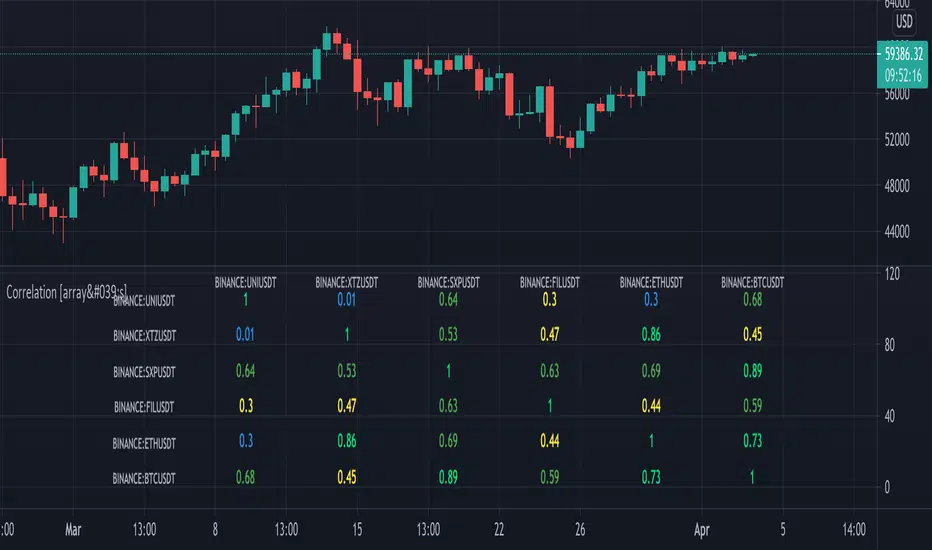
This script isn't about creating a correlation script with labels, there is a perfect working example of Mango2Juice
(Correlation Matrix, which was inspired by Daveatt's Correlation Matrix)
The intention was making it with the use of as less code as possible, looping through array's
The Pine correlation function doesn't work consistently in a local scope (loop), so I had to work around it
Inspired by ZenAndTheArtOfTrading's Correlation Meter (using array.covariance and array.stdev) and
especially with the help of RicardoSantos and LonesomeTheBlue I've managed to do this
Symbols, timeframe, look-back period, colors and limits can be changed
There is always room for improvement, but I think it shows what is possible.
Many thanks to the people who I've mentioned, and of course to Tradingview!
(Without the Earth nothing can grow)
Cheers!
نص برمجي مفتوح المصدر
بروح TradingView الحقيقية، قام مبتكر هذا النص البرمجي بجعله مفتوح المصدر، بحيث يمكن للمتداولين مراجعة وظائفه والتحقق منها. شكرا للمؤلف! بينما يمكنك استخدامه مجانًا، تذكر أن إعادة نشر الكود يخضع لقواعد الموقع الخاصة بنا.
Who are PineCoders?
tradingview.com/chart/SSP/yW5eOqtm-Who-are-PineCoders/
TG Pine Script® Q&A: t.me/PineCodersQA
- We cannot control our emotions,
but we can control our keyboard -
tradingview.com/chart/SSP/yW5eOqtm-Who-are-PineCoders/
TG Pine Script® Q&A: t.me/PineCodersQA
- We cannot control our emotions,
but we can control our keyboard -
إخلاء المسؤولية
لا يُقصد بالمعلومات والمنشورات أن تكون، أو تشكل، أي نصيحة مالية أو استثمارية أو تجارية أو أنواع أخرى من النصائح أو التوصيات المقدمة أو المعتمدة من TradingView. اقرأ المزيد في شروط الاستخدام.
