PROTECTED SOURCE SCRIPT
تم تحديثه Six Sigma Enhanced
This script is a study of the Two Six Sigma patterns explored in the December 2018 issue of Technical Analysis of Stocks & Commodities (Stocks & Commodities V. 36:12 (8–12): Identifying High-Probability Buy Signals by François Picard, MS , & Edmond Miresco, PhD )
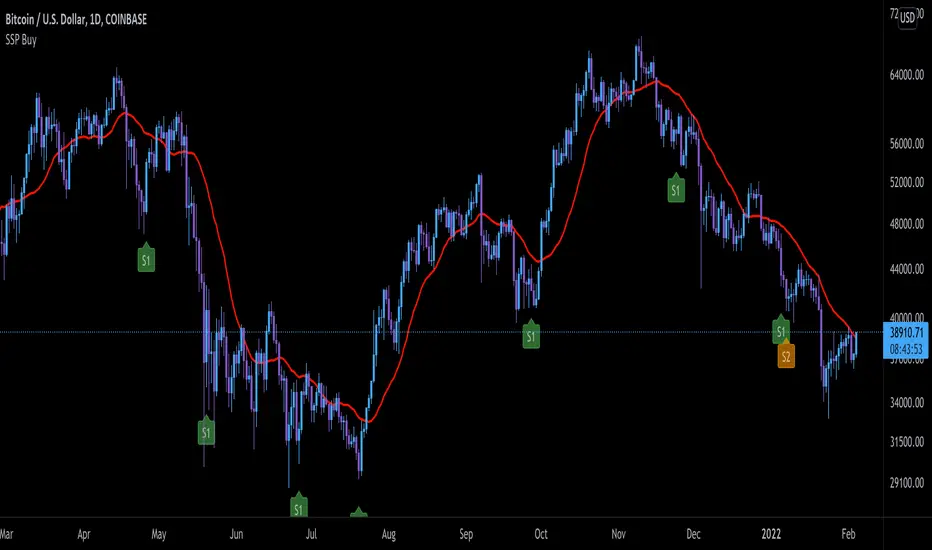
Signal 1 - 9 Closes Under MA
The first (Signal #1 or S1 on the chart) indicates 9 consecutive closes below the 20-period moving average. In the study, the authors used a simple moving average however I have modified it to use a MA to account for price distribution
Signal 2 - 6 Lower Closes and 9 Closes Under MA
The second signal (Signal #2 or S2 on the chart) indicates six consecutive periods where the close value is lower than the previous close and Signal 1.
Filter Signal Code provided by tradingview.com/u/AllTradeSignals/
ملاحظات الأخبار
SMA is used to calculate plot lineملاحظات الأخبار
migrated to v5نص برمجي محمي
تم نشر هذا النص البرمجي كمصدر مغلق. ومع ذلك، يمكنك استخدامه بحرية ودون أي قيود - تعرف على المزيد هنا.
إخلاء المسؤولية
لا يُقصد بالمعلومات والمنشورات أن تكون، أو تشكل، أي نصيحة مالية أو استثمارية أو تجارية أو أنواع أخرى من النصائح أو التوصيات المقدمة أو المعتمدة من TradingView. اقرأ المزيد في شروط الاستخدام.
نص برمجي محمي
تم نشر هذا النص البرمجي كمصدر مغلق. ومع ذلك، يمكنك استخدامه بحرية ودون أي قيود - تعرف على المزيد هنا.
إخلاء المسؤولية
لا يُقصد بالمعلومات والمنشورات أن تكون، أو تشكل، أي نصيحة مالية أو استثمارية أو تجارية أو أنواع أخرى من النصائح أو التوصيات المقدمة أو المعتمدة من TradingView. اقرأ المزيد في شروط الاستخدام.