OPEN-SOURCE SCRIPT
Delivery Volume Indicator
Delivery Volume Indicator
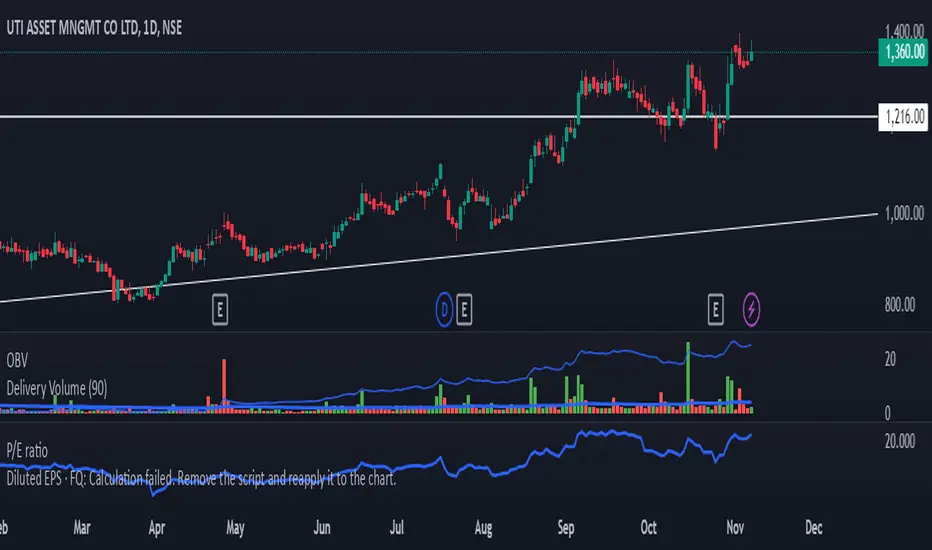
The Delivery Volume Indicator is designed to provide insights into trading volume specifically delivered on a daily basis, scaled in lakhs (hundreds of thousands) for ease of interpretation. This tool can be especially useful for traders looking to monitor delivery-based volume changes and trends, as it helps to distinguish between bullish and bearish volume flows.
Key Features:
Daily Volume in Lakhs: The indicator pulls daily volume data and scales it to lakhs for more readable values.
Bullish/Bearish Color Coding: The indicator color-codes volume columns to reflect market sentiment. Columns are displayed in green when the price closes higher than it opens (bullish) and in red when the price closes lower than it opens (bearish).
Adjustable EMA: A customizable Exponential Moving Average (EMA) is applied to the scaled delivery volume. The EMA line, displayed in blue, helps smooth out volume trends and allows traders to adjust the period for personal strategy alignment.
How to Use:
Observe the delivery volume changes to track market sentiment over time. Increased bullish delivery volume could indicate accumulating interest, while increased bearish delivery volume might suggest distribution.
Utilize the EMA to identify longer-term trends in delivery volume, with shorter EMA periods for quick volume shifts and longer periods for gradual trend changes.
This indicator is ideal for traders seeking volume-based insights that align closely with price action.
نص برمجي مفتوح المصدر
بروح TradingView الحقيقية، قام مبتكر هذا النص البرمجي بجعله مفتوح المصدر، بحيث يمكن للمتداولين مراجعة وظائفه والتحقق منها. شكرا للمؤلف! بينما يمكنك استخدامه مجانًا، تذكر أن إعادة نشر الكود يخضع لقواعد الموقع الخاصة بنا.
إخلاء المسؤولية
لا يُقصد بالمعلومات والمنشورات أن تكون، أو تشكل، أي نصيحة مالية أو استثمارية أو تجارية أو أنواع أخرى من النصائح أو التوصيات المقدمة أو المعتمدة من TradingView. اقرأ المزيد في شروط الاستخدام.