OPEN-SOURCE SCRIPT
Accumulation/Distribution
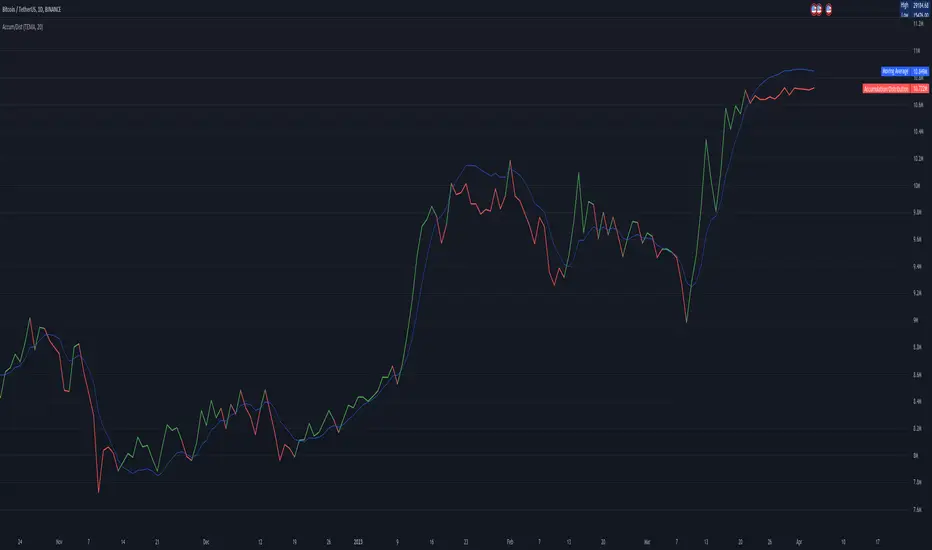
Accumulation/Distribution explains when the big players buy or sell, according to Wyckoff.
I added some colors to make it more visibly, to get a hint when (not) to invest.
A/D is a lagging indicator.
When the MA is above A/D line, this should reflect distribution time, and big players are selling.
The oppsite is when MA is below the A/D line, then this should be an accumulation phase, and big players are buying.
For example, my preference is a TEMA20 for crypto, this gives me good results.
But I added a bunch of moving averages to choose from.
Depending on preferences/marked you can choose a moving average, set its length, and you can choose all the colors too.
I recommend the Volume indicator to setup the MA line, and this will get much better results!

I hope this script will help some people to do some better decisions.
And I am pleased to get some advice to make this script even better!
There is only one similar-sounding script in the public section.
Kudos go to jbneto with his Accum/ Dist + 200 EMA which gave me the inspiration.
It has a EMA200, and its focus is on the daily pivot price.
I added some colors to make it more visibly, to get a hint when (not) to invest.
A/D is a lagging indicator.
When the MA is above A/D line, this should reflect distribution time, and big players are selling.
The oppsite is when MA is below the A/D line, then this should be an accumulation phase, and big players are buying.
For example, my preference is a TEMA20 for crypto, this gives me good results.
But I added a bunch of moving averages to choose from.
Depending on preferences/marked you can choose a moving average, set its length, and you can choose all the colors too.
I recommend the Volume indicator to setup the MA line, and this will get much better results!
I hope this script will help some people to do some better decisions.
And I am pleased to get some advice to make this script even better!
There is only one similar-sounding script in the public section.
Kudos go to jbneto with his Accum/ Dist + 200 EMA which gave me the inspiration.
It has a EMA200, and its focus is on the daily pivot price.
نص برمجي مفتوح المصدر
بروح TradingView الحقيقية، قام مبتكر هذا النص البرمجي بجعله مفتوح المصدر، بحيث يمكن للمتداولين مراجعة وظائفه والتحقق منها. شكرا للمؤلف! بينما يمكنك استخدامه مجانًا، تذكر أن إعادة نشر الكود يخضع لقواعد الموقع الخاصة بنا.
إخلاء المسؤولية
لا يُقصد بالمعلومات والمنشورات أن تكون، أو تشكل، أي نصيحة مالية أو استثمارية أو تجارية أو أنواع أخرى من النصائح أو التوصيات المقدمة أو المعتمدة من TradingView. اقرأ المزيد في شروط الاستخدام.