OPEN-SOURCE SCRIPT
Quartile For Loop [SeerQuant]

Quartile For Loop (QFL) [SeerQuant]
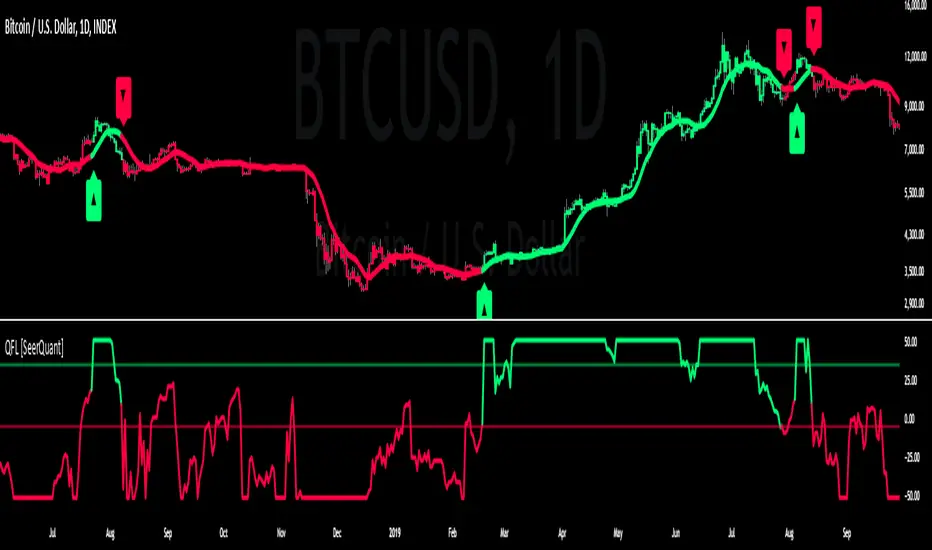
- The Quartile For Loop (QFL) is an advanced trend-following and scoring oscillator designed to detect momentum shifts and trend transitions using a quartile-based analysis. By leveraging quartile calculations and iterative scoring logic, QFL delivers dynamic trend signals which can be tailored to suit various market conditions.
--------------------------------------------------------------------------------------------------
⚙️ How It Works
1️⃣ Quartile-Based Calculation
The indicator calculates the weighted average of the first quartile (Q1), median (Q2), and third quartile (Q3) over a customizable length, providing a robust adaptive trend value.
2️⃣ For Loop Scoring System
A unique for-loop structure iteratively scores each quartile value against historical data, delivering actionable trend signals. Users can toggle between price-based and quartile-based scoring methods for flexibility.
3️⃣ Threshold Logic
4️⃣ Visual Trend Enhancements
Optional candle coloring and a color-coded SMA provide clear visual cues for identifying trend direction. The adaptive quartile is dynamically updated to reflect changing market conditions.
--------------------------------------------------------------------------------------------------
✨ Customizable Settings
Indicator Inputs
Loop Settings
Style Settings
--------------------------------------------------------------------------------------------------
🚀 Features and Benefits
--------------------------------------------------------------------------------------------------
📜 Disclaimer
This indicator is for educational purposes only and does not constitute financial advice. Market analysis is inherently speculative and subject to risk. Users should consult a licensed financial advisor before making trading decisions. Use at your own discretion.
--------------------------------------------------------------------------------------------------
- The Quartile For Loop (QFL) is an advanced trend-following and scoring oscillator designed to detect momentum shifts and trend transitions using a quartile-based analysis. By leveraging quartile calculations and iterative scoring logic, QFL delivers dynamic trend signals which can be tailored to suit various market conditions.
--------------------------------------------------------------------------------------------------
⚙️ How It Works
1️⃣ Quartile-Based Calculation
The indicator calculates the weighted average of the first quartile (Q1), median (Q2), and third quartile (Q3) over a customizable length, providing a robust adaptive trend value.
2️⃣ For Loop Scoring System
A unique for-loop structure iteratively scores each quartile value against historical data, delivering actionable trend signals. Users can toggle between price-based and quartile-based scoring methods for flexibility.
3️⃣ Threshold Logic
- Bullish (Uptrend): Score exceeds the positive threshold.
- Bearish (Downtrend): Score falls below the negative threshold.
- Neutral: Score remains between thresholds.
4️⃣ Visual Trend Enhancements
Optional candle coloring and a color-coded SMA provide clear visual cues for identifying trend direction. The adaptive quartile is dynamically updated to reflect changing market conditions.
--------------------------------------------------------------------------------------------------
✨ Customizable Settings
Indicator Inputs
- Quartile Length: Define the calculation length for quartile analysis.
- Calculation Source: Choose the data source for quartile calculations (e.g., close price).
- Alternate Signal: Toggle between price-based and quartile-based scoring.
Loop Settings
- Start/End Points: Set the range for the for-loop scoring system.
- Thresholds: Customize uptrend and downtrend thresholds.
Style Settings
- Candle Coloring: Enable optional trend-based candle coloring.
- Color Schemes: Select from five unique palettes for trend visualization.
--------------------------------------------------------------------------------------------------
🚀 Features and Benefits
- Quartile-Driven Analysis: Harnesses the statistical power of quartiles for adaptive trend evaluation.
- Dynamic Scoring: Iterative scoring logic adjusts to market fluctuations.
- Clear Visual Representation: Color-coded histograms, candles, and trendlines enhance readability.
- Fully Customizable: Flexible inputs allow adaptation to diverse trading styles and strategies.
--------------------------------------------------------------------------------------------------
📜 Disclaimer
This indicator is for educational purposes only and does not constitute financial advice. Market analysis is inherently speculative and subject to risk. Users should consult a licensed financial advisor before making trading decisions. Use at your own discretion.
--------------------------------------------------------------------------------------------------
نص برمجي مفتوح المصدر
بروح TradingView الحقيقية، قام مبتكر هذا النص البرمجي بجعله مفتوح المصدر، بحيث يمكن للمتداولين مراجعة وظائفه والتحقق منها. شكرا للمؤلف! بينما يمكنك استخدامه مجانًا، تذكر أن إعادة نشر الكود يخضع لقواعد الموقع الخاصة بنا.
Analytics & Charting Platform 👉 seerquant.org
إخلاء المسؤولية
لا يُقصد بالمعلومات والمنشورات أن تكون، أو تشكل، أي نصيحة مالية أو استثمارية أو تجارية أو أنواع أخرى من النصائح أو التوصيات المقدمة أو المعتمدة من TradingView. اقرأ المزيد في شروط الاستخدام.