PROTECTED SOURCE SCRIPT
تم تحديثه Vmoon By:Vasma
Vmoon Indicator by Vasma
Overview:
The Vmoon indicator is an advanced tool designed for trend following and momentum trading, uniquely combining the Average True Range (ATR) with a Double Exponential Moving Average (DEMA). Unlike standard indicators, Vmoon provides traders with a dual-layered approach to detect trend reversals and confirm momentum, making it a robust solution for identifying trading opportunities in various market conditions.
Key Features and Calculation Methodology:
Average True Range (ATR) Based Trend Detection:
ATR Period: The user can define the ATR period, with a default setting of 12 periods. This period is crucial for accurately measuring market volatility over the chosen timeframe.
ATR Multiplier: Set at a default of 3.0, the multiplier adjusts the ATR range to determine dynamic support and resistance levels, allowing the indicator to adapt to different market conditions.
Custom ATR Calculation Method: Traders can choose between a simple moving average of the true range or the built-in ATR method. This flexibility allows for personalized risk management and signal sensitivity.
Upper and Lower Bands: These bands are calculated by adding and subtracting the ATR value from the price (hl2 by default). The bands serve as dynamic thresholds—when price breaks above the upper band, it suggests an upward trend, and breaking below the lower band suggests a downward trend.
The Vmoon indicator doesn't just plot these bands; it dynamically adjusts them based on price action, providing a real-time, adaptive system for trend detection.
Innovative Trend Identification:
Real-Time Trend Tracking: The indicator monitors price movements relative to the ATR bands, continuously updating the trend direction. This allows for quick identification of trend changes, which is critical in volatile markets.
Trend Change Detection: Vmoon captures shifts from upward to downward trends (and vice versa) with precision, generating actionable buy or sell signals. This feature helps traders stay ahead of market reversals.
Double Exponential Moving Average (DEMA) Integration:
DEMA Calculation: The Vmoon indicator uses a 200-period DEMA, which is known for reducing lag and providing a faster reaction to price changes compared to traditional moving averages. This ensures that the indicator responds promptly to emerging trends.
Crossover-Based Momentum Confirmation: The indicator generates signals based on price crossovers with the 200-period DEMA:
Buy Signal: A green triangle appears when the price crosses above the DEMA, signaling potential bullish momentum.
Sell Signal: A red triangle is displayed when the price crosses below the DEMA, indicating possible bearish momentum.
The DEMA component of Vmoon offers a long-term perspective on market momentum, acting as a filter to confirm the strength and direction of the trend.
Customizable Alerts:
Vmoon includes fully customizable alert conditions, allowing traders to stay informed about critical market movements:
Buy Signal Alert: Notifies when the trend changes from downward to upward, indicating a potential buying opportunity.
Sell Signal Alert: Alerts when the trend shifts from upward to downward, signaling a possible selling point.
General Trend Change Alert: Keeps traders aware of any direction changes, helping them to react quickly to potential reversals.
How to Use Vmoon:
Dynamic Trend Following: Use the ATR-based upper and lower bands as dynamic support and resistance levels. Monitor for breakouts to identify trend reversals.
Momentum Confirmation with DEMA: Validate trend signals by watching for price crossovers with the 200-period DEMA, ensuring that the trend is supported by strong momentum.
Signal Interpretation: Act on the buy and sell signals displayed on the chart, supported by optional alerts, to make informed trading decisions in real time.
Enhanced Customization Options:
Adjustable ATR Settings: Modify the ATR period and multiplier to better align with your trading strategy and market conditions.
Selectable ATR Calculation Method: Choose the ATR method that best suits your risk tolerance and market analysis approach.
Configurable Signal Display: Tailor the indicator to show or hide buy/sell signals based on your preferences.
Personalized Alerts: Set alerts that match your specific trading needs, ensuring that you never miss a significant market move.
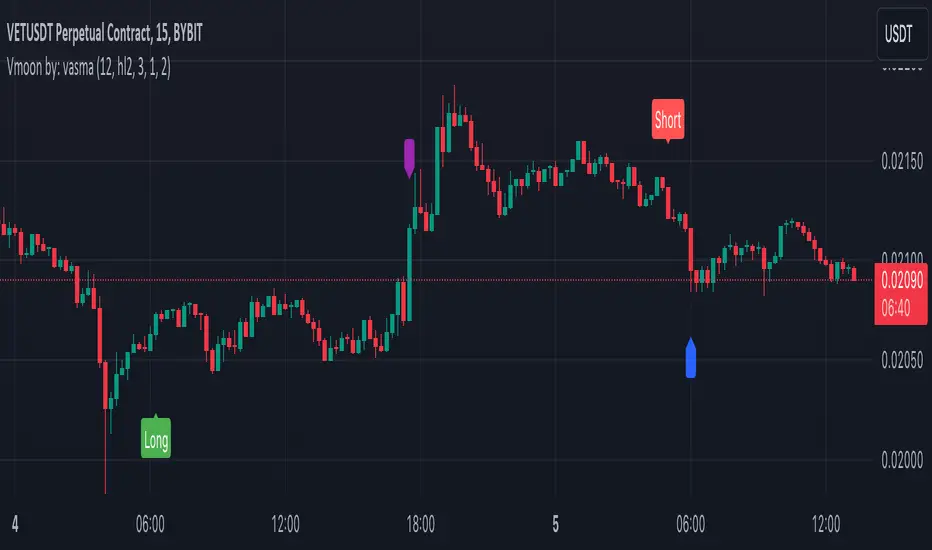
Visual Representation:
Vmoon provides a clear and concise visual representation on the chart, with distinct markers for buy and sell signals, dynamic ATR bands, and the 200-period DEMA. This visualization helps traders quickly interpret market conditions and make timely decisions.
Why Vmoon is Unique:
Vmoon stands out by integrating ATR-based dynamic thresholds with the reduced-lag DEMA, offering a comprehensive solution for trend identification and momentum confirmation. This combination is not commonly found in standard indicators, and the flexibility in customization ensures that Vmoon can be adapted to suit various trading strategies and market environments. The proprietary logic behind Vmoon’s signal generation, particularly in how it adjusts to market volatility, is what makes it both powerful and worthy of protection as a closed-source script.
Overview:
The Vmoon indicator is an advanced tool designed for trend following and momentum trading, uniquely combining the Average True Range (ATR) with a Double Exponential Moving Average (DEMA). Unlike standard indicators, Vmoon provides traders with a dual-layered approach to detect trend reversals and confirm momentum, making it a robust solution for identifying trading opportunities in various market conditions.
Key Features and Calculation Methodology:
Average True Range (ATR) Based Trend Detection:
ATR Period: The user can define the ATR period, with a default setting of 12 periods. This period is crucial for accurately measuring market volatility over the chosen timeframe.
ATR Multiplier: Set at a default of 3.0, the multiplier adjusts the ATR range to determine dynamic support and resistance levels, allowing the indicator to adapt to different market conditions.
Custom ATR Calculation Method: Traders can choose between a simple moving average of the true range or the built-in ATR method. This flexibility allows for personalized risk management and signal sensitivity.
Upper and Lower Bands: These bands are calculated by adding and subtracting the ATR value from the price (hl2 by default). The bands serve as dynamic thresholds—when price breaks above the upper band, it suggests an upward trend, and breaking below the lower band suggests a downward trend.
The Vmoon indicator doesn't just plot these bands; it dynamically adjusts them based on price action, providing a real-time, adaptive system for trend detection.
Innovative Trend Identification:
Real-Time Trend Tracking: The indicator monitors price movements relative to the ATR bands, continuously updating the trend direction. This allows for quick identification of trend changes, which is critical in volatile markets.
Trend Change Detection: Vmoon captures shifts from upward to downward trends (and vice versa) with precision, generating actionable buy or sell signals. This feature helps traders stay ahead of market reversals.
Double Exponential Moving Average (DEMA) Integration:
DEMA Calculation: The Vmoon indicator uses a 200-period DEMA, which is known for reducing lag and providing a faster reaction to price changes compared to traditional moving averages. This ensures that the indicator responds promptly to emerging trends.
Crossover-Based Momentum Confirmation: The indicator generates signals based on price crossovers with the 200-period DEMA:
Buy Signal: A green triangle appears when the price crosses above the DEMA, signaling potential bullish momentum.
Sell Signal: A red triangle is displayed when the price crosses below the DEMA, indicating possible bearish momentum.
The DEMA component of Vmoon offers a long-term perspective on market momentum, acting as a filter to confirm the strength and direction of the trend.
Customizable Alerts:
Vmoon includes fully customizable alert conditions, allowing traders to stay informed about critical market movements:
Buy Signal Alert: Notifies when the trend changes from downward to upward, indicating a potential buying opportunity.
Sell Signal Alert: Alerts when the trend shifts from upward to downward, signaling a possible selling point.
General Trend Change Alert: Keeps traders aware of any direction changes, helping them to react quickly to potential reversals.
How to Use Vmoon:
Dynamic Trend Following: Use the ATR-based upper and lower bands as dynamic support and resistance levels. Monitor for breakouts to identify trend reversals.
Momentum Confirmation with DEMA: Validate trend signals by watching for price crossovers with the 200-period DEMA, ensuring that the trend is supported by strong momentum.
Signal Interpretation: Act on the buy and sell signals displayed on the chart, supported by optional alerts, to make informed trading decisions in real time.
Enhanced Customization Options:
Adjustable ATR Settings: Modify the ATR period and multiplier to better align with your trading strategy and market conditions.
Selectable ATR Calculation Method: Choose the ATR method that best suits your risk tolerance and market analysis approach.
Configurable Signal Display: Tailor the indicator to show or hide buy/sell signals based on your preferences.
Personalized Alerts: Set alerts that match your specific trading needs, ensuring that you never miss a significant market move.
Visual Representation:
Vmoon provides a clear and concise visual representation on the chart, with distinct markers for buy and sell signals, dynamic ATR bands, and the 200-period DEMA. This visualization helps traders quickly interpret market conditions and make timely decisions.
Why Vmoon is Unique:
Vmoon stands out by integrating ATR-based dynamic thresholds with the reduced-lag DEMA, offering a comprehensive solution for trend identification and momentum confirmation. This combination is not commonly found in standard indicators, and the flexibility in customization ensures that Vmoon can be adapted to suit various trading strategies and market environments. The proprietary logic behind Vmoon’s signal generation, particularly in how it adjusts to market volatility, is what makes it both powerful and worthy of protection as a closed-source script.
ملاحظات الأخبار
Vmoon Indicator by VasmaOverview:
The Vmoon indicator is an advanced tool designed for trend following and momentum trading, uniquely combining the Average True Range (ATR) with a Double Exponential Moving Average (DEMA). Unlike standard indicators, Vmoon provides traders with a dual-layered approach to detect trend reversals and confirm momentum, making it a robust solution for identifying trading opportunities in various market conditions.
Key Features and Calculation Methodology:
Average True Range (ATR) Based Trend Detection:
ATR Period: The user can define the ATR period, with a default setting of 12 periods. This period is crucial for accurately measuring market volatility over the chosen timeframe.
ATR Multiplier: Set at a default of 3.0, the multiplier adjusts the ATR range to determine dynamic support and resistance levels, allowing the indicator to adapt to different market conditions.
Custom ATR Calculation Method: Traders can choose between a simple moving average of the true range or the built-in ATR method. This flexibility allows for personalized risk management and signal sensitivity.
Upper and Lower Bands: These bands are calculated by adding and subtracting the ATR value from the price (hl2 by default). The bands serve as dynamic thresholds—when price breaks above the upper band, it suggests an upward trend, and breaking below the lower band suggests a downward trend.
The Vmoon indicator doesn't just plot these bands; it dynamically adjusts them based on price action, providing a real-time, adaptive system for trend detection.
Innovative Trend Identification:
Real-Time Trend Tracking: The indicator monitors price movements relative to the ATR bands, continuously updating the trend direction. This allows for quick identification of trend changes, which is critical in volatile markets.
Trend Change Detection: Vmoon captures shifts from upward to downward trends (and vice versa) with precision, generating actionable buy or sell signals. This feature helps traders stay ahead of market reversals.
Double Exponential Moving Average (DEMA) Integration:
DEMA Calculation: The Vmoon indicator uses a 200-period DEMA, which is known for reducing lag and providing a faster reaction to price changes compared to traditional moving averages. This ensures that the indicator responds promptly to emerging trends.
Crossover-Based Momentum Confirmation: The indicator generates signals based on price crossovers with the 200-period DEMA:
Buy Signal: A green triangle appears when the price crosses above the DEMA, signaling potential bullish momentum.
Sell Signal: A red triangle is displayed when the price crosses below the DEMA, indicating possible bearish momentum.
The DEMA component of Vmoon offers a long-term perspective on market momentum, acting as a filter to confirm the strength and direction of the trend.
Customizable Alerts:
Vmoon includes fully customizable alert conditions, allowing traders to stay informed about critical market movements:
Buy Signal Alert: Notifies when the trend changes from downward to upward, indicating a potential buying opportunity.
Sell Signal Alert: Alerts when the trend shifts from upward to downward, signaling a possible selling point.
General Trend Change Alert: Keeps traders aware of any direction changes, helping them to react quickly to potential reversals.
How to Use Vmoon:
Dynamic Trend Following: Use the ATR-based upper and lower bands as dynamic support and resistance levels. Monitor for breakouts to identify trend reversals.
Momentum Confirmation with DEMA: Validate trend signals by watching for price crossovers with the 200-period DEMA, ensuring that the trend is supported by strong momentum.
Signal Interpretation: Act on the buy and sell signals displayed on the chart, supported by optional alerts, to make informed trading decisions in real time.
Enhanced Customization Options:
Adjustable ATR Settings: Modify the ATR period and multiplier to better align with your trading strategy and market conditions.
Selectable ATR Calculation Method: Choose the ATR method that best suits your risk tolerance and market analysis approach.
Configurable Signal Display: Tailor the indicator to show or hide buy/sell signals based on your preferences.
Personalized Alerts: Set alerts that match your specific trading needs, ensuring that you never miss a significant market move.
Visual Representation:
Vmoon provides a clear and concise visual representation on the chart, with distinct markers for buy and sell signals, dynamic ATR bands, and the 200-period DEMA. This visualization helps traders quickly interpret market conditions and make timely decisions.
Why Vmoon is Unique:
Vmoon stands out by integrating ATR-based dynamic thresholds with the reduced-lag DEMA, offering a comprehensive solution for trend identification and momentum confirmation. This combination is not commonly found in standard indicators, and the flexibility in customization ensures that Vmoon can be adapted to suit various trading strategies and market environments. The proprietary logic behind Vmoon’s signal generation, particularly in how it adjusts to market volatility, is what makes it both powerful and worthy of protection as a closed-source script.
نص برمجي محمي
تم نشر هذا النص البرمجي كمصدر مغلق. ومع ذلك، يمكنك استخدامه بحرية ودون أي قيود - تعرف على المزيد هنا.
إخلاء المسؤولية
لا يُقصد بالمعلومات والمنشورات أن تكون، أو تشكل، أي نصيحة مالية أو استثمارية أو تجارية أو أنواع أخرى من النصائح أو التوصيات المقدمة أو المعتمدة من TradingView. اقرأ المزيد في شروط الاستخدام.