PROTECTED SOURCE SCRIPT
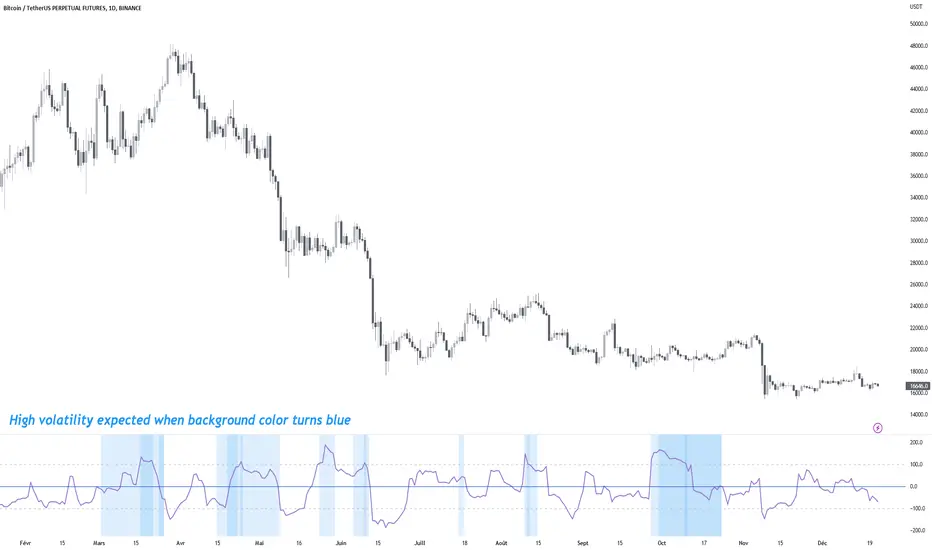
MTF Choppiness Index

Multi Time Frame Choppiness Index
Draw the choppiness index on multiple time frames (maximum 5).
Once a chop is charged on one time frame (above 100), the background will be coloured on the indicator window.
More the background is coloured, more there are charged time frames, and more you can expect high volatility .
A table of charged time frames will appear to indicate which time frame has its chop charged.
By default, the computed time frames will be a factor of your current chart time frame. Go to the Inputs tab in configuration to make them static if you need it.
By default, only the chop line of the current time frame is displayed. Go to the Style tab in configuration to display other time frame lines.
If you are using a lower time frame than your current chart, the line will not be accurate because of missing values.
Made by Trust The Setup 🤖
نص برمجي محمي
تم نشر هذا النص البرمجي كمصدر مغلق. ومع ذلك، يمكنك استخدامه بحرية ودون أي قيود - تعرف على المزيد هنا.
إخلاء المسؤولية
لا يُقصد بالمعلومات والمنشورات أن تكون، أو تشكل، أي نصيحة مالية أو استثمارية أو تجارية أو أنواع أخرى من النصائح أو التوصيات المقدمة أو المعتمدة من TradingView. اقرأ المزيد في شروط الاستخدام.