OPEN-SOURCE SCRIPT
Dynamic Candle Range Point Indicator
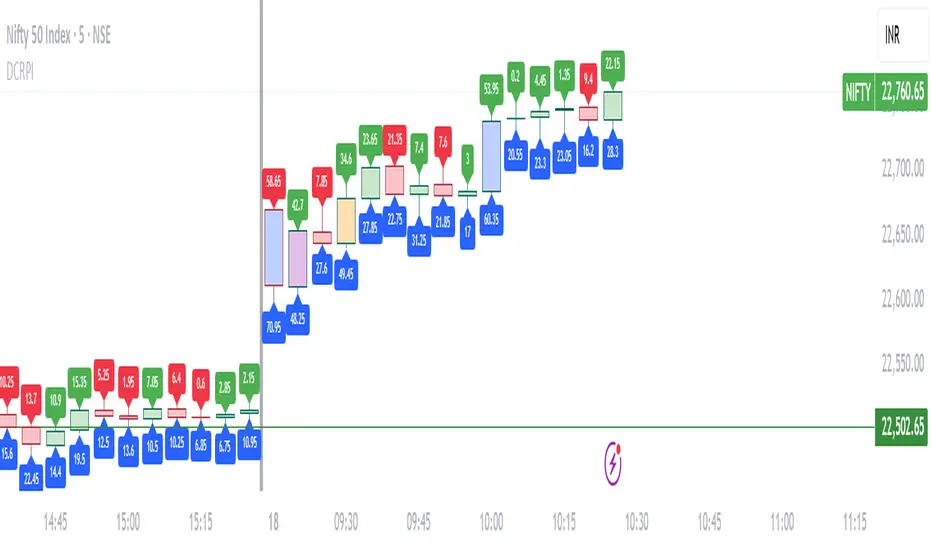
The "Dynamic Candle Range Point Indicator" (DCRPI) does two important jobs at once. For each candle on your chart, it shows you exactly how many points the price moved in two different ways:
1. At the top of each candle, you'll see how many points the price moved from open to close (the body range)
2. At the bottom, you'll see the total movement from the highest to lowest point (the full range)
The really smart part is how it colors the borders of candles based on how much the price moved. This gives you a quick visual way to spot significant price movements:
- Small movements keep the standard green/red colors
- Medium movements (25-30 points) show as yellow
- Larger movements get more unique colors (orange, purple, blue, etc.)
This makes it easy to instantly identify which candles had the most significant price movement without having to read all the numbers. You can quickly spot the most volatile candles across your chart by their distinctive border colors.
The indicator is lightweight and should run smoothly on most charts without causing performance issues.
نص برمجي مفتوح المصدر
بروح TradingView الحقيقية، قام مبتكر هذا النص البرمجي بجعله مفتوح المصدر، بحيث يمكن للمتداولين مراجعة وظائفه والتحقق منها. شكرا للمؤلف! بينما يمكنك استخدامه مجانًا، تذكر أن إعادة نشر الكود يخضع لقواعد الموقع الخاصة بنا.
إخلاء المسؤولية
لا يُقصد بالمعلومات والمنشورات أن تكون، أو تشكل، أي نصيحة مالية أو استثمارية أو تجارية أو أنواع أخرى من النصائح أو التوصيات المقدمة أو المعتمدة من TradingView. اقرأ المزيد في شروط الاستخدام.