OPEN-SOURCE SCRIPT
Kendall Rank Correlation Coefficient (alt)
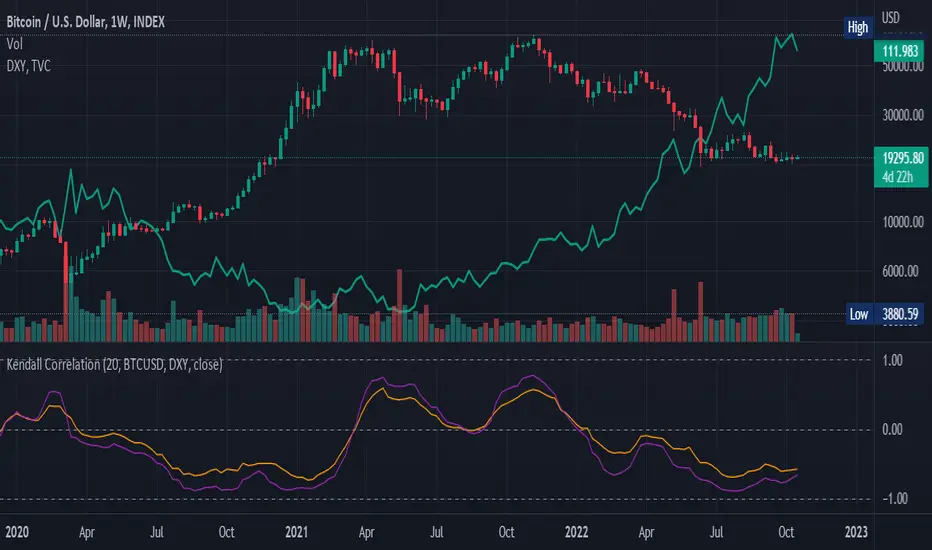
This is a non-parametric correlation statistical test, which is less sensitive to magnitude and more to direction, hence why some people call this a "concordance test".
This indicator was originally created by Alex Orekhov (everget), if you like this one, please show the original author some love:
This version is extended by tartigradia (2022) to make it more readily useable:
* Update to pinescript v5
* Default compare to current symbol (instead of only fixed symbols)
* Add 1.0, 0.0 and -1.0 correlation levels lines.
This indicator plots both the Kendall correlation in orange, and the more classical parametric Pearson correlation in purple for comparison. Either can be disabled in the Style tab.
نص برمجي مفتوح المصدر
بروح TradingView الحقيقية، قام مبتكر هذا النص البرمجي بجعله مفتوح المصدر، بحيث يمكن للمتداولين مراجعة وظائفه والتحقق منها. شكرا للمؤلف! بينما يمكنك استخدامه مجانًا، تذكر أن إعادة نشر الكود يخضع لقواعد الموقع الخاصة بنا.
إخلاء المسؤولية
لا يُقصد بالمعلومات والمنشورات أن تكون، أو تشكل، أي نصيحة مالية أو استثمارية أو تجارية أو أنواع أخرى من النصائح أو التوصيات المقدمة أو المعتمدة من TradingView. اقرأ المزيد في شروط الاستخدام.