OPEN-SOURCE SCRIPT
تم تحديثه Classic_Levels
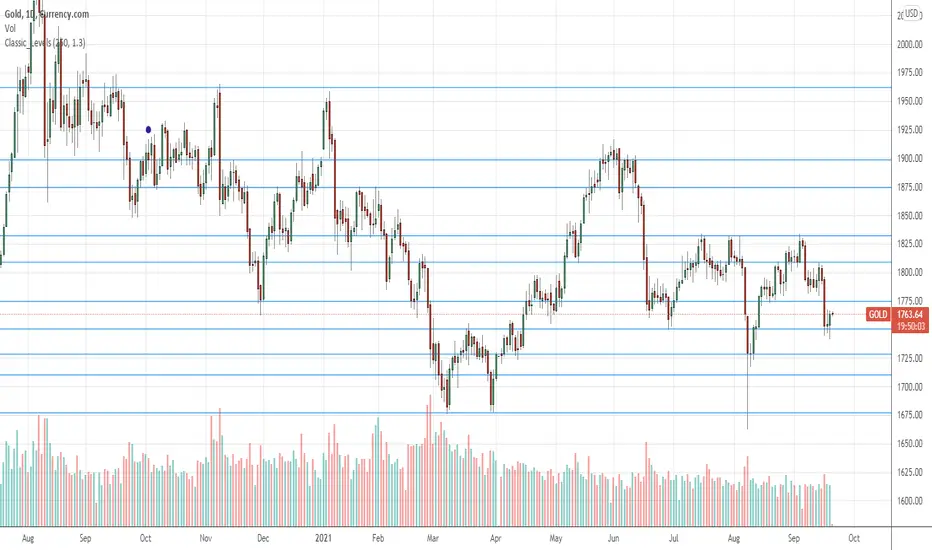
Displays horizontal lines that represent support and resistance levels.
You can use it with any symbol and on any timeframe.
Parameter 'Time range' means number of candles in consideration. The beginning of the range is marked with a little violet circle.
The more 'Sensitivity' is, the more levels are displayed.
You can use it with any symbol and on any timeframe.
Parameter 'Time range' means number of candles in consideration. The beginning of the range is marked with a little violet circle.
The more 'Sensitivity' is, the more levels are displayed.
ملاحظات الأخبار
Little changes in comments and variable names.ملاحظات الأخبار
Some internal coefficients changed.ملاحظات الأخبار
***ملاحظات الأخبار
Little corrections to the algorithm.ملاحظات الأخبار
Increased performance.ملاحظات الأخبار
Function was removed.ملاحظات الأخبار
Array used.ملاحظات الأخبار
Algorithm slightly changed, performance improved.نص برمجي مفتوح المصدر
بروح TradingView الحقيقية، قام مبتكر هذا النص البرمجي بجعله مفتوح المصدر، بحيث يمكن للمتداولين مراجعة وظائفه والتحقق منها. شكرا للمؤلف! بينما يمكنك استخدامه مجانًا، تذكر أن إعادة نشر الكود يخضع لقواعد الموقع الخاصة بنا.
إخلاء المسؤولية
لا يُقصد بالمعلومات والمنشورات أن تكون، أو تشكل، أي نصيحة مالية أو استثمارية أو تجارية أو أنواع أخرى من النصائح أو التوصيات المقدمة أو المعتمدة من TradingView. اقرأ المزيد في شروط الاستخدام.
نص برمجي مفتوح المصدر
بروح TradingView الحقيقية، قام مبتكر هذا النص البرمجي بجعله مفتوح المصدر، بحيث يمكن للمتداولين مراجعة وظائفه والتحقق منها. شكرا للمؤلف! بينما يمكنك استخدامه مجانًا، تذكر أن إعادة نشر الكود يخضع لقواعد الموقع الخاصة بنا.
إخلاء المسؤولية
لا يُقصد بالمعلومات والمنشورات أن تكون، أو تشكل، أي نصيحة مالية أو استثمارية أو تجارية أو أنواع أخرى من النصائح أو التوصيات المقدمة أو المعتمدة من TradingView. اقرأ المزيد في شروط الاستخدام.