OPEN-SOURCE SCRIPT
volatility-weighted price change divergence
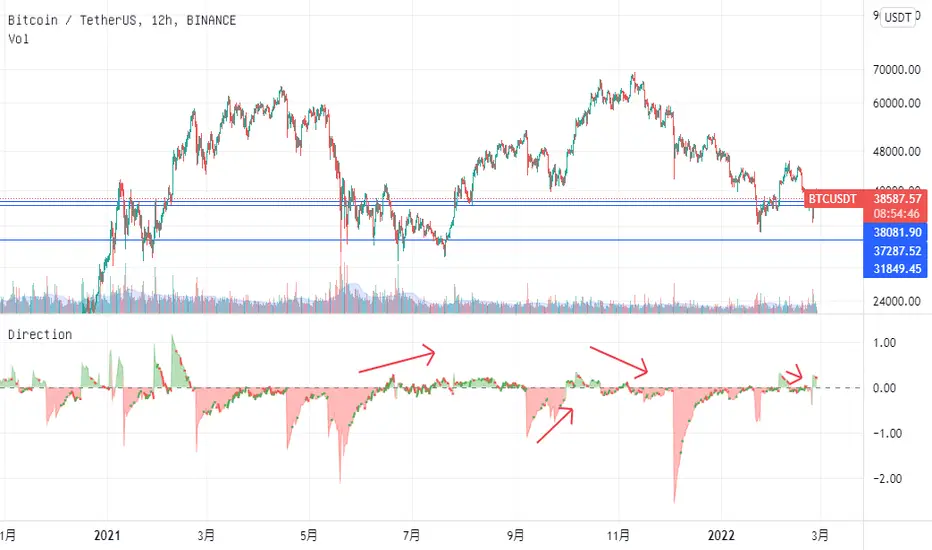
EMA of intrabar-volatility-weighted price change minus EMA of price change. It puts more weights on candles that have large volatility inside, and assumes that the direction of those high-volatility candles are more meaningful than low-volatility ones. Therefore, we take the difference between the volatility-weighted price change and the regular price change and plot the EMA. The indicator may be used as a tool to find divergence and potential reversal, or hints of continuation of a strong trend. Note that this indicator can change a lot with different time frames and settings, so take care to backtest before using. Recommended settings are 15m resolution for time frames longer than 4H and 1m resolution (with 200 EMA length) for time frames below 4H. The resolution is used to find the intrabar volatility.
نص برمجي مفتوح المصدر
بروح TradingView الحقيقية، قام مبتكر هذا النص البرمجي بجعله مفتوح المصدر، بحيث يمكن للمتداولين مراجعة وظائفه والتحقق منها. شكرا للمؤلف! بينما يمكنك استخدامه مجانًا، تذكر أن إعادة نشر الكود يخضع لقواعد الموقع الخاصة بنا.
إخلاء المسؤولية
لا يُقصد بالمعلومات والمنشورات أن تكون، أو تشكل، أي نصيحة مالية أو استثمارية أو تجارية أو أنواع أخرى من النصائح أو التوصيات المقدمة أو المعتمدة من TradingView. اقرأ المزيد في شروط الاستخدام.