OPEN-SOURCE SCRIPT
Approx STH Unrealized Profit [Relative %]
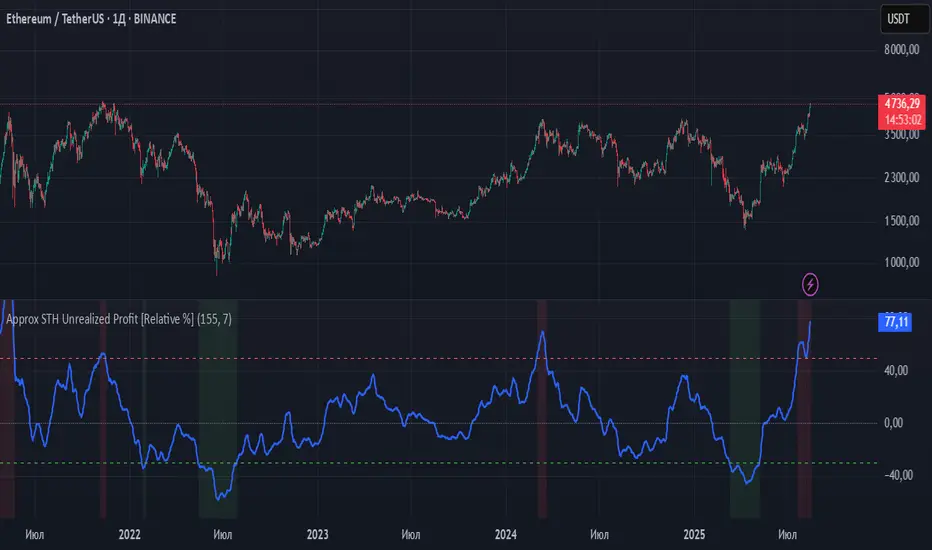
This indicator estimates the unrealized profit or loss of short-term holders (STH) without requiring on-chain data. Instead of using actual STH Realized Price (average purchase price), it employs a 155-day Simple Moving Average (SMA) to approximate the behavior of "recent buyers."
How It Works
The indicator calculates the percentage deviation between the current price and the 155-day SMA using the formula:
(Current Price - 155 SMA) / 155 SMA * 100%.
Positive values indicate profit, while negative values show loss. Key threshold levels are set at +50% (overbought) and -30% (oversold).
Trading Applications
Profit > 50% - STH are experiencing significant profits, suggesting potential correction. Consider taking partial profits.
0% < Profit < 50% - Moderate profits indicate the trend may continue. Maintain positions.
Profit ≈ 0% - Price is near STH's average entry point, showing market indecision.
-30% < Profit < 0% - STH are at a loss, potentially signaling accumulation opportunities.
Profit < -30% - Extreme oversold conditions may present buying opportunities.
Limitations
SMA only approximates STH behavior.
May produce false signals during sideways markets.
SMA lag can be noticeable in strong trending markets.
Recommendation
For improved accuracy, combine this indicator with trend-following tools (200 EMA, Volume analysis) and other technical indicators. It serves best as a supplementary tool for identifying overbought/oversold market conditions within your trading strategy.
نص برمجي مفتوح المصدر
بروح TradingView الحقيقية، قام مبتكر هذا النص البرمجي بجعله مفتوح المصدر، بحيث يمكن للمتداولين مراجعة وظائفه والتحقق منها. شكرا للمؤلف! بينما يمكنك استخدامه مجانًا، تذكر أن إعادة نشر الكود يخضع لقواعد الموقع الخاصة بنا.
💡 Обсуждаем торговые идеи , делимся индикаторами и стратегиями в нашем Telegram-чате:
👉 t.me/+AQWwxRhhrXI0YTgy
👉 t.me/+AQWwxRhhrXI0YTgy
إخلاء المسؤولية
لا يُقصد بالمعلومات والمنشورات أن تكون، أو تشكل، أي نصيحة مالية أو استثمارية أو تجارية أو أنواع أخرى من النصائح أو التوصيات المقدمة أو المعتمدة من TradingView. اقرأ المزيد في شروط الاستخدام.