OPEN-SOURCE SCRIPT
تم تحديثه Relative Performance Table
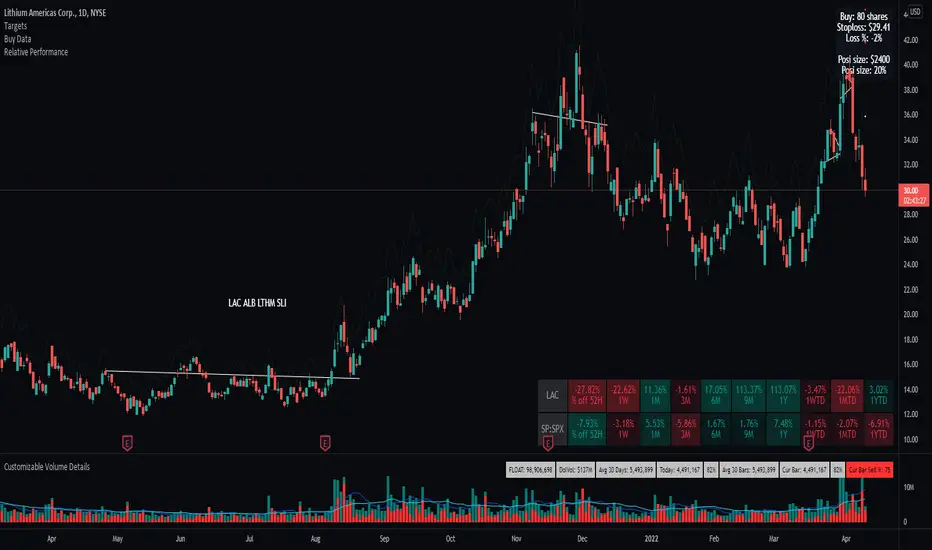
This indicator is based on the Performance section in the TradingView's sidebar and uses new Pine tables functionality, originally coded by @Beeholder. It compares the current price of the symbol to its past price and calculates the rate of return to make it easier to track the performance of the symbol. Note that the Performance sidebar is not updated in real-time, while this indicator is, so on real-time charts the values between the two can differ (the indicator's values are more recent). Made a number of enhancement from Bee's script including relative performance of a selected ticker, dynamic table columns, and other options.
The formula of the calculation is (Current value - Past value) * 100 / Past value, where Past value is:
--Future development will include the ability to transpose the table columns/rows
The formula of the calculation is (Current value - Past value) * 100 / Past value, where Past value is:
- 1W
- 1M
- 3M
- 6M
- 9M
- 52W (1 Year)
- WTD (Week to Date)
- MTD (Month to Date)
- YTD (Year to Date
--Future development will include the ability to transpose the table columns/rows
ملاحظات الأخبار
--Minor fix to tooltipملاحظات الأخبار
Added 52 week high calculation to quickly screen whether a ticker is within 25% of the 52 week Highsنص برمجي مفتوح المصدر
بروح TradingView الحقيقية، قام مبتكر هذا النص البرمجي بجعله مفتوح المصدر، بحيث يمكن للمتداولين مراجعة وظائفه والتحقق منها. شكرا للمؤلف! بينما يمكنك استخدامه مجانًا، تذكر أن إعادة نشر الكود يخضع لقواعد الموقع الخاصة بنا.
إخلاء المسؤولية
لا يُقصد بالمعلومات والمنشورات أن تكون، أو تشكل، أي نصيحة مالية أو استثمارية أو تجارية أو أنواع أخرى من النصائح أو التوصيات المقدمة أو المعتمدة من TradingView. اقرأ المزيد في شروط الاستخدام.
نص برمجي مفتوح المصدر
بروح TradingView الحقيقية، قام مبتكر هذا النص البرمجي بجعله مفتوح المصدر، بحيث يمكن للمتداولين مراجعة وظائفه والتحقق منها. شكرا للمؤلف! بينما يمكنك استخدامه مجانًا، تذكر أن إعادة نشر الكود يخضع لقواعد الموقع الخاصة بنا.
إخلاء المسؤولية
لا يُقصد بالمعلومات والمنشورات أن تكون، أو تشكل، أي نصيحة مالية أو استثمارية أو تجارية أو أنواع أخرى من النصائح أو التوصيات المقدمة أو المعتمدة من TradingView. اقرأ المزيد في شروط الاستخدام.