OPEN-SOURCE SCRIPT
تم تحديثه Rotation Cycles Graph
Rotation Cycles Graph Indicator
Overview:
The Rotation Cycles Graph Indicator is designed to visualize rotation cycles in financial markets. It aims to provide insights into shifts between various market phases, including growth, weakening, recovery, and contraction, allowing traders to potentially identify changing market dynamics.
Key Components:
Customizable Parameters:
The indicator offers users the flexibility to adjust several parameters:
Understanding Coordinates:
The x and y coordinates plotted on the chart represent specific market conditions. Interpretation of these coordinates aids in recognizing shifts in market behavior.
This screenshot shows visual representation behind logic of X and Y and their rotation cycles

Here is an example how rotation marker moved from growing to weakening and to the contraction quad, during a big market crush:

Note:
This indicator is a visualization tool and should be used in conjunction with other analytical methods for comprehensive market analysis.
Understanding the context and nuances of market dynamics is essential for accurate interpretation of the Rotation Cycles Graph Indicator.
Big thanks to PineCodersTASC for their indicator, what I used as a reference
https://in.tradingview.com/script/AsEv0Vxd-TASC-2022-07-Pairs-Rotation-With-Ehlers-Loops/
Overview:
The Rotation Cycles Graph Indicator is designed to visualize rotation cycles in financial markets. It aims to provide insights into shifts between various market phases, including growth, weakening, recovery, and contraction, allowing traders to potentially identify changing market dynamics.
Key Components:
- Z-Score Calculation:
The indicator employs Z-score calculation to normalize data and identify deviations from the mean. This is instrumental in understanding the current state of the market relative to its historical behavior. - Ehlers Loop Visualization:
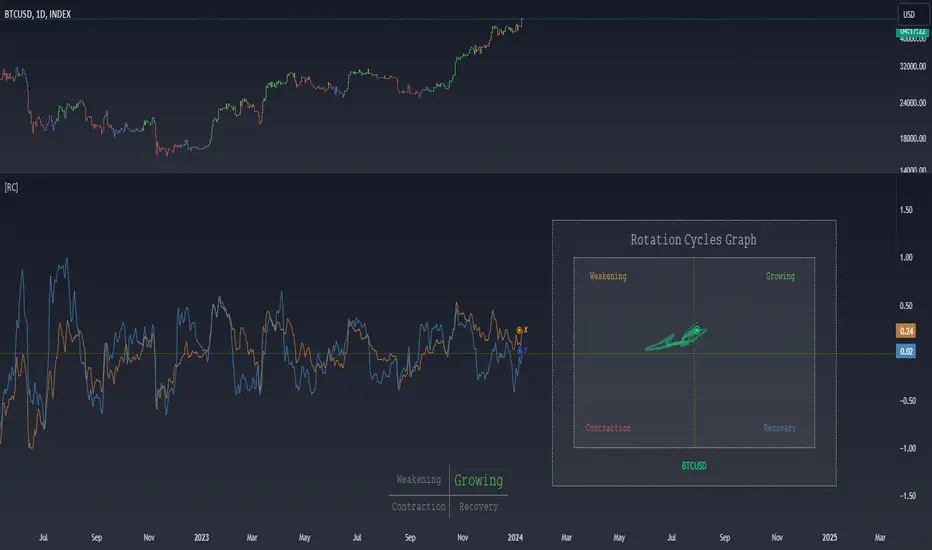
The Ehlers Loop function generates a visual representation of rotation cycles. It utilizes x and y coordinates on the chart to represent market conditions. These coordinates determine the position and categorization of the market state. - Table Visualization:
At the bottom of the chart, a table categorizes market conditions based on x and y values. This table serves as a reference to understand the current market phase.
Customizable Parameters:
The indicator offers users the flexibility to adjust several parameters:
- Length and Smoothness: Users can set the length and smoothness parameters for the Z-score calculation, allowing for customization based on the market's volatility.
- Graph Settings: Parameters such as bar scale, graph position, and the length of the tail for visualization can be fine-tuned to suit individual preferences.
Understanding Coordinates:
The x and y coordinates plotted on the chart represent specific market conditions. Interpretation of these coordinates aids in recognizing shifts in market behavior.
This screenshot shows visual representation behind logic of X and Y and their rotation cycles
Here is an example how rotation marker moved from growing to weakening and to the contraction quad, during a big market crush:
Note:
This indicator is a visualization tool and should be used in conjunction with other analytical methods for comprehensive market analysis.
Understanding the context and nuances of market dynamics is essential for accurate interpretation of the Rotation Cycles Graph Indicator.
Big thanks to PineCodersTASC for their indicator, what I used as a reference
https://in.tradingview.com/script/AsEv0Vxd-TASC-2022-07-Pairs-Rotation-With-Ehlers-Loops/
ملاحظات الأخبار
Rescale functionملاحظات الأخبار
Moved name of the ticker to the bottom of the graphملاحظات الأخبار
-ملاحظات الأخبار
Alerts Updateنص برمجي مفتوح المصدر
بروح TradingView الحقيقية، قام مبتكر هذا النص البرمجي بجعله مفتوح المصدر، بحيث يمكن للمتداولين مراجعة وظائفه والتحقق منها. شكرا للمؤلف! بينما يمكنك استخدامه مجانًا، تذكر أن إعادة نشر الكود يخضع لقواعد الموقع الخاصة بنا.
إخلاء المسؤولية
لا يُقصد بالمعلومات والمنشورات أن تكون، أو تشكل، أي نصيحة مالية أو استثمارية أو تجارية أو أنواع أخرى من النصائح أو التوصيات المقدمة أو المعتمدة من TradingView. اقرأ المزيد في شروط الاستخدام.
نص برمجي مفتوح المصدر
بروح TradingView الحقيقية، قام مبتكر هذا النص البرمجي بجعله مفتوح المصدر، بحيث يمكن للمتداولين مراجعة وظائفه والتحقق منها. شكرا للمؤلف! بينما يمكنك استخدامه مجانًا، تذكر أن إعادة نشر الكود يخضع لقواعد الموقع الخاصة بنا.
إخلاء المسؤولية
لا يُقصد بالمعلومات والمنشورات أن تكون، أو تشكل، أي نصيحة مالية أو استثمارية أو تجارية أو أنواع أخرى من النصائح أو التوصيات المقدمة أو المعتمدة من TradingView. اقرأ المزيد في شروط الاستخدام.