PROTECTED SOURCE SCRIPT
TrendFlow
The TrendFlow_VolHub is a clean, trend-following indicator built on a simple yet effective core of Exponential Moving Averages (EMAs). It provides clear visual cues for trend direction, volatility, and key support/resistance levels.
Key Features
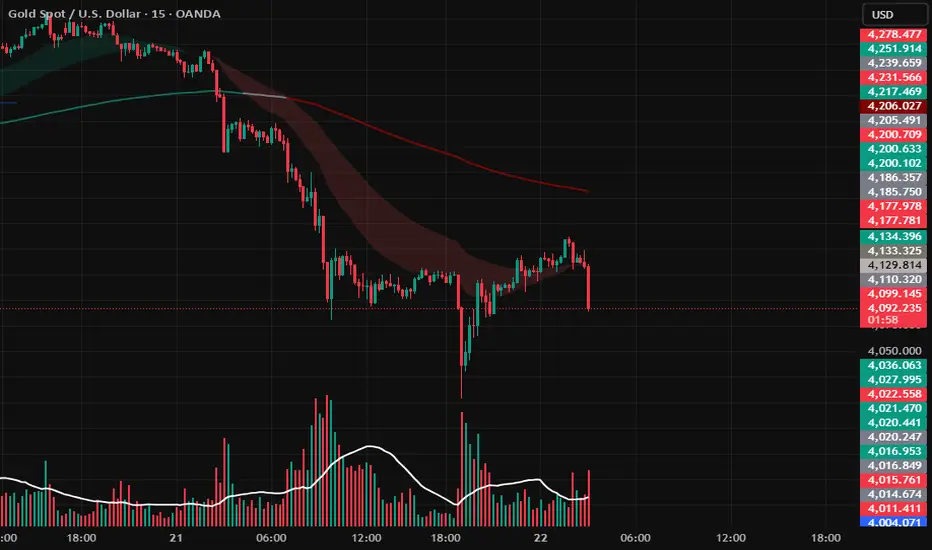
Dynamic EMA Ribbon (21/50):
The area between the EMA 21 and EMA 50 is filled with color to clearly visualize the short-term trend momentum.
Green Fill: EMA 21 is above EMA 50 (Bullish Momentum).
Red Fill: EMA 21 is below EMA 50 (Bearish Momentum).
A user-adjustable Fill Opacity input (0-100) is included for customization.
Dynamic EMA 200 (Long-Term Filter):
The EMA 200 serves as a powerful long-term trend filter and major support/resistance.
Its color dynamically changes based on its position relative to the EMA 21 and EMA 50:
Teal/Green: EMA 200 is below both the 21 and 50 (Strong Bullish Alignment).
Red/Maroon: EMA 200 is above both the 21 and 50 (Strong Bearish Alignment).
Gray: The EMAs are crossing or choppy (Neutral/Consolidation).
Suggested Use
Trend Confirmation: Use the Ribbon color (Green/Red) to confirm the immediate directional bias.
Trend Strength: Use the EMA 200 color as a high-level filter. A bullish ribbon (green) combined with a teal/green 200 EMA suggests a high-conviction uptrend.
Dynamic S/R: The EMA lines themselves can be used as dynamic support and resistance levels.
Key Features
Dynamic EMA Ribbon (21/50):
The area between the EMA 21 and EMA 50 is filled with color to clearly visualize the short-term trend momentum.
Green Fill: EMA 21 is above EMA 50 (Bullish Momentum).
Red Fill: EMA 21 is below EMA 50 (Bearish Momentum).
A user-adjustable Fill Opacity input (0-100) is included for customization.
Dynamic EMA 200 (Long-Term Filter):
The EMA 200 serves as a powerful long-term trend filter and major support/resistance.
Its color dynamically changes based on its position relative to the EMA 21 and EMA 50:
Teal/Green: EMA 200 is below both the 21 and 50 (Strong Bullish Alignment).
Red/Maroon: EMA 200 is above both the 21 and 50 (Strong Bearish Alignment).
Gray: The EMAs are crossing or choppy (Neutral/Consolidation).
Suggested Use
Trend Confirmation: Use the Ribbon color (Green/Red) to confirm the immediate directional bias.
Trend Strength: Use the EMA 200 color as a high-level filter. A bullish ribbon (green) combined with a teal/green 200 EMA suggests a high-conviction uptrend.
Dynamic S/R: The EMA lines themselves can be used as dynamic support and resistance levels.
نص برمجي محمي
تم نشر هذا النص البرمجي كمصدر مغلق. ومع ذلك، يمكنك استخدامه بحرية ودون أي قيود - تعرف على المزيد هنا.
إخلاء المسؤولية
لا يُقصد بالمعلومات والمنشورات أن تكون، أو تشكل، أي نصيحة مالية أو استثمارية أو تجارية أو أنواع أخرى من النصائح أو التوصيات المقدمة أو المعتمدة من TradingView. اقرأ المزيد في شروط الاستخدام.