PROTECTED SOURCE SCRIPT
atrATR
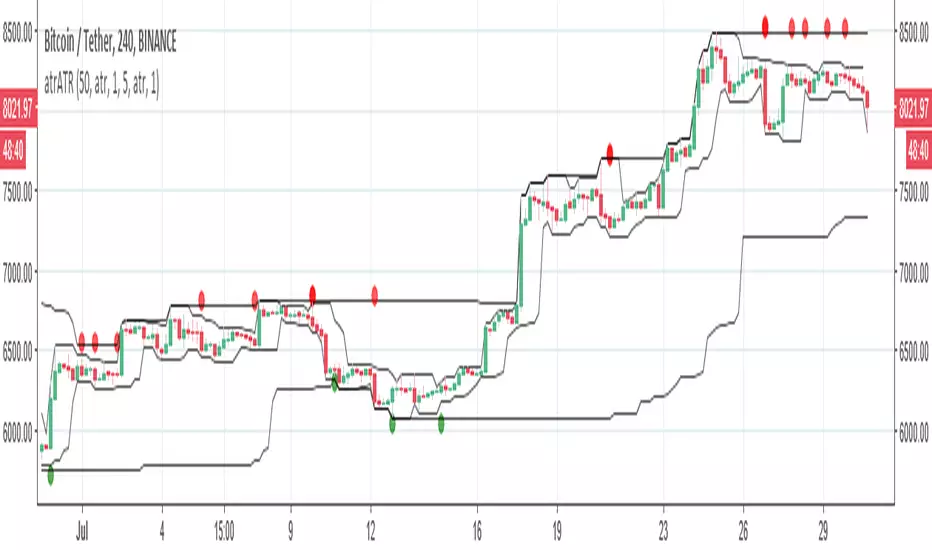
so this easy to see indicator based on ATR and donochian channel
there is fast and there is slow channels . when they are kissing each other then either in the low point or high point is change of trend. for example: the price went to high point and the fast channel is departing down from the slow this is time to sell.
the opposite when the fast channel departing up from the slow channel
it the same mechanism of the linear regression just more accurate.
the circles are just point where ATR think it time to buy or sell. but this is easy way to think on trends and to figure out if you going short or long
نص برمجي محمي
تم نشر هذا النص البرمجي كمصدر مغلق. ومع ذلك، يمكنك استخدامه بحرية ودون أي قيود - تعرف على المزيد هنا.
إخلاء المسؤولية
لا يُقصد بالمعلومات والمنشورات أن تكون، أو تشكل، أي نصيحة مالية أو استثمارية أو تجارية أو أنواع أخرى من النصائح أو التوصيات المقدمة أو المعتمدة من TradingView. اقرأ المزيد في شروط الاستخدام.