PROTECTED SOURCE SCRIPT
Relative Performance Analysis
Relative Performance Analysis Script
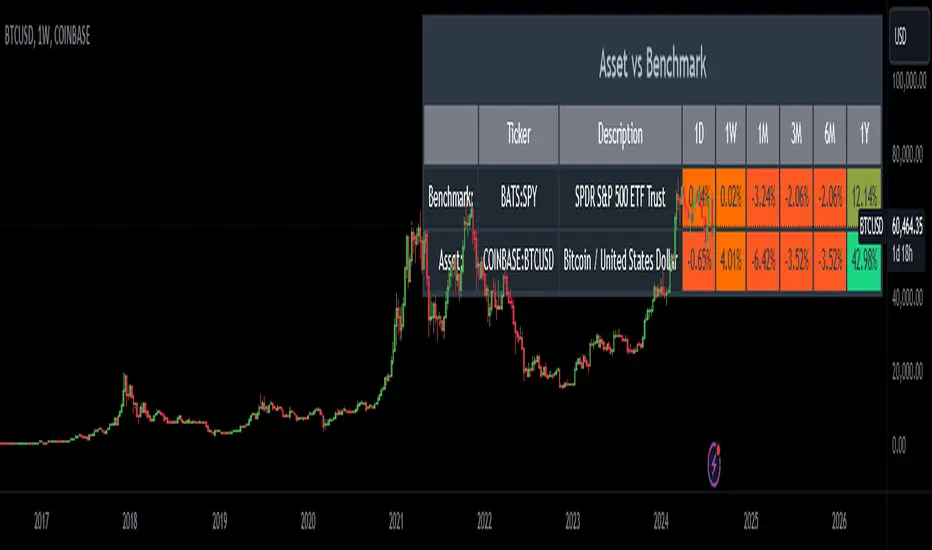
This Pine Script creates a detailed table on your TradingView chart to compare the performance of a specified asset against a benchmark over multiple time frames. The table is fully customizable, allowing you to select its location on the chart and display performance metrics for different periods.
Features:
Inputs:
Usage:
Disclaimer:
This script is for informational and educational purposes only and is not intended as financial advice. The performance data displayed in the table is based on historical prices and is not indicative of future performance. Trading involves risk, and you should always do your own research and consult with a qualified financial advisor before making any investment decisions. The creator of this script assumes no responsibility for any losses or damages incurred as a result of using this tool.
This Pine Script creates a detailed table on your TradingView chart to compare the performance of a specified asset against a benchmark over multiple time frames. The table is fully customizable, allowing you to select its location on the chart and display performance metrics for different periods.
Features:
- Customizable Table Location: Choose where the table appears on your chart from a range of predefined positions (e.g., bottom left, top center).
- Dynamic Column Headers: The table includes columns for the ticker, description, and performance metrics for various time periods (1 day, 1 week, 1 month, 3 months, 6 months, and 1 year).
- Performance Calculation: Calculates the percentage change in performance between the current close price and the previous close price for each time frame.
- Color-Coded Performance: Uses a color scheme to highlight performance levels, with specific colors for positive and negative changes to easily visualize performance trends.
- Benchmark and Asset Comparison: Displays performance metrics for both a benchmark (e.g., SPY) and the asset currently viewed on the chart, providing a clear comparison.
Inputs:
- Benchmark Symbol: Specify the symbol of the benchmark asset (e.g., SPY).
- Benchmark Description: Provide a description for the benchmark asset.
- Chart Symbol: Automatically uses the symbol of the chart for comparison.
Usage:
- Add the script to your TradingView chart.
- Configure the benchmark symbol and description as needed.
- The table will automatically populate with performance data and be positioned according to your selection.
Disclaimer:
This script is for informational and educational purposes only and is not intended as financial advice. The performance data displayed in the table is based on historical prices and is not indicative of future performance. Trading involves risk, and you should always do your own research and consult with a qualified financial advisor before making any investment decisions. The creator of this script assumes no responsibility for any losses or damages incurred as a result of using this tool.
نص برمجي محمي
تم نشر هذا النص البرمجي كمصدر مغلق. ومع ذلك، يمكنك استخدامه بحرية ودون أي قيود - تعرف على المزيد هنا.
إخلاء المسؤولية
لا يُقصد بالمعلومات والمنشورات أن تكون، أو تشكل، أي نصيحة مالية أو استثمارية أو تجارية أو أنواع أخرى من النصائح أو التوصيات المقدمة أو المعتمدة من TradingView. اقرأ المزيد في شروط الاستخدام.